ATON - Daily - Technical analysis published on 06/12/2024 (GMT)
- 170
- 0
Click here for a new analysis!
- Timeframe : Daily
- - Analysis generated on
- Status : INVALID

Summary of the analysis

Additional analysis
Quotes
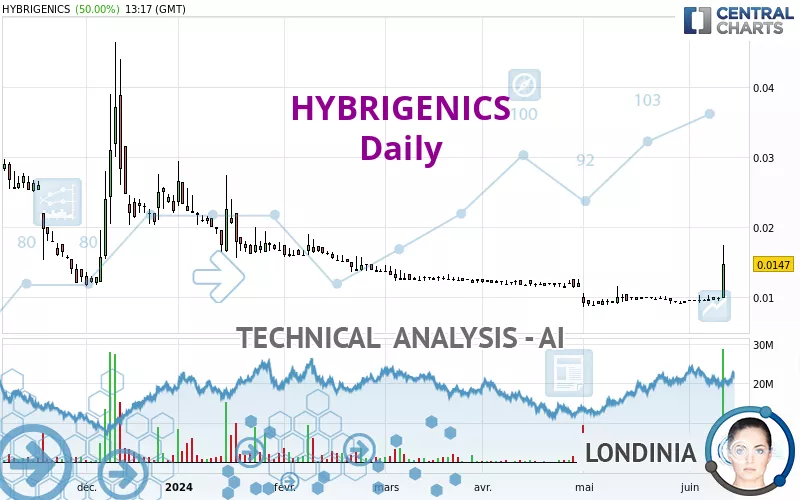
The HYBRIGENICS price is 0.0147 EUR. The price has increased by +50.00% since the last closing with the lowest point at 0.0098 EUR and the highest point at 0.0173 EUR. The deviation from the price is +50.00% for the low point and -15.03% for the high point.So that you have an overall view of the price change, here is a table showing the variations over several periods:
New HIGH record (1 month)
Type : Bullish
Timeframe : Weekly
The Central Volumes scanner notes the presence of abnormal volumes:
Abnormal volumes
Timeframe : 5 days
Technical
A technical analysis in Daily of this HYBRIGENICS chart shows a slightly bullish trend. 60.71% of the signals given by moving averages are bullish. The overall trend could accelerate as strong bullish signals from short-term moving averages are expected. The Central Indicators scanner detects bullish signals on moving averages that could impact this trend:
Bullish price crossover with Moving Average 50
Type : Bullish
Timeframe : Daily
Bullish price crossover with Moving Average 100
Type : Bullish
Timeframe : Daily
Bullish price crossover with adaptative moving average 20
Type : Bullish
Timeframe : Daily
Bullish price crossover with adaptative moving average 50
Type : Bullish
Timeframe : Daily
Bullish price crossover with adaptative moving average 100
Type : Bullish
Timeframe : Daily
In fact, according to the parameters integrated into the Central Analyzer system, 15 technical indicators out of 18 analysed are currently bullish. Caution: the Central Indicators scanner currently detects an excess:
RSI indicator is overbought : over 80
Type : Neutral
Timeframe : Daily
CCI indicator is overbought : over 100
Type : Neutral
Timeframe : Daily
Pivot points : price is over resistance 3
Type : Neutral
Timeframe : Daily
Pivot points : price is over resistance 3
Type : Neutral
Timeframe : Weekly
Parabolic SAR indicator bullish reversal
Type : Bullish
Timeframe : Daily
Ichimoku : price is over the cloud
Type : Bullish
Timeframe : Daily
SuperTrend indicator bullish reversal
Type : Bullish
Timeframe : Daily
MACD indicator is back over 0
Type : Bullish
Timeframe : Daily
Ichimoku - Bullish crossover : Tenkan & Kijun
Type : Bullish
Timeframe : Daily
Central Patterns, the market scanner focusing on chart patterns, resistances and supports found this result:
Horizontal resistance is broken
Type : Bullish
Timeframe : Daily
The presence of these bullish Japanese candlestick patterns detected by Central Candlesticks that could cause a very short term rebound were also noted:
White line without lower shadow
Type : Bullish
Timeframe : Daily
Long white line
Type : Bullish
Timeframe : Daily
| S2 | S1 | Price | R1 | R2 | R3 | |
|---|---|---|---|---|---|---|
| ProTrendLines | 0.0087 | 0.0123 | 0.0147 | 0.0266 | 0.0371 | 0.0523 |
| Change (%) | -40.82% | -16.33% | - | +80.95% | +152.38% | +255.78% |
| Change | -0.0060 | -0.0024 | - | +0.0119 | +0.0224 | +0.0376 |
| Level | Intermediate | Minor | - | Minor | Intermediate | Intermediate |
Attention could also be paid to pivot points to set price objectives:
| Pivot points | S3 | S2 | S1 | PP | R1 | R2 | R3 |
|---|---|---|---|---|---|---|---|
| Standard | 0.0090 | 0.0092 | 0.0095 | 0.0097 | 0.0100 | 0.0102 | 0.0105 |
| Camarilla | 0.0097 | 0.0097 | 0.0098 | 0.0098 | 0.0099 | 0.0099 | 0.0099 |
| Woodie | 0.0091 | 0.0092 | 0.0096 | 0.0097 | 0.0101 | 0.0102 | 0.0106 |
| Fibonacci | 0.0092 | 0.0094 | 0.0095 | 0.0097 | 0.0099 | 0.0100 | 0.0102 |
| Pivot points | S3 | S2 | S1 | PP | R1 | R2 | R3 |
|---|---|---|---|---|---|---|---|
| Standard | 0.0080 | 0.0086 | 0.0091 | 0.0097 | 0.0102 | 0.0108 | 0.0113 |
| Camarilla | 0.0094 | 0.0095 | 0.0096 | 0.0097 | 0.0098 | 0.0099 | 0.0100 |
| Woodie | 0.0081 | 0.0086 | 0.0092 | 0.0097 | 0.0103 | 0.0108 | 0.0114 |
| Fibonacci | 0.0086 | 0.0090 | 0.0093 | 0.0097 | 0.0101 | 0.0104 | 0.0108 |
| Pivot points | S3 | S2 | S1 | PP | R1 | R2 | R3 |
|---|---|---|---|---|---|---|---|
| Standard | 0.0049 | 0.0067 | 0.0079 | 0.0097 | 0.0109 | 0.0127 | 0.0139 |
| Camarilla | 0.0083 | 0.0086 | 0.0088 | 0.0091 | 0.0094 | 0.0097 | 0.0099 |
| Woodie | 0.0046 | 0.0066 | 0.0076 | 0.0096 | 0.0106 | 0.0126 | 0.0136 |
| Fibonacci | 0.0067 | 0.0079 | 0.0086 | 0.0097 | 0.0109 | 0.0116 | 0.0127 |
Numerical data
The following is the status of technical indicators and moving averages registered at the time this technical analysis was created:
| RSI (14): | 80.18 | |
| MACD (12,26,9): | 0.0002 | |
| Directional Movement: | 51.7403 | |
| AROON (14): | 78.5714 | |
| DEMA (21): | 0.0102 | |
| Parabolic SAR (0,02-0,02-0,2): | 0.0085 | |
| Elder Ray (13): | 0.0033 | |
| Super Trend (3,10): | 0.0097 | |
| Zig ZAG (10): | 0.0145 | |
| VORTEX (21): | 1.0114 | |
| Stochastique (14,3,5): | 69.31 | |
| TEMA (21): | 0.0108 | |
| Williams %R (14): | -33.73 | |
| Chande Momentum Oscillator (20): | 0.0050 | |
| Repulse (5,40,3): | 33.4770 | |
| ROCnROLL: | 1 | |
| TRIX (15,9): | -0.3667 | |
| Courbe Coppock: | 15.89 |
| MA7: | 0.0103 | |
| MA20: | 0.0098 | |
| MA50: | 0.0105 | |
| MA100: | 0.0125 | |
| MAexp7: | 0.0109 | |
| MAexp20: | 0.0101 | |
| MAexp50: | 0.0108 | |
| MAexp100: | 0.0142 | |
| Price / MA7: | +42.72% | |
| Price / MA20: | +50.00% | |
| Price / MA50: | +40.00% | |
| Price / MA100: | +17.60% | |
| Price / MAexp7: | +34.86% | |
| Price / MAexp20: | +45.54% | |
| Price / MAexp50: | +36.11% | |
| Price / MAexp100: | +3.52% |
News
The last news published on HYBRIGENICS at the time of the generation of this analysis was as follows:
About author
Online


Add a comment
Comments
0 comments on the analysis ATON - Daily