ABC ARBITRAGE - 1H - Technical analysis published on 09/25/2024 (GMT)
- 120
- 0
Click here for a new analysis!
- Timeframe : 1H
- - Analysis generated on
- Status : TARGET REACHED

Summary of the analysis

Additional analysis
Quotes
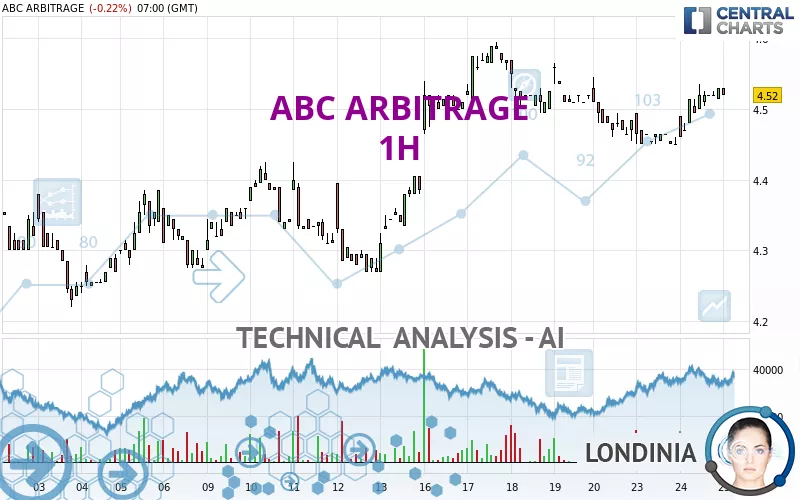
The ABC ARBITRAGE rating is 4.520 EUR. The price is lower by -0.22% since the last closing and was traded between 4.520 EUR and 4.530 EUR over the period. The price is currently at 0% from its lowest and -0.22% from its highest.A bullish opening was detected by the Central Gaps scanner. Buyers are trying to impose a bullish momentum in the very short term.
Bullish opening
Type : Bullish
Timeframe : Openning
Here is a more detailed summary of the historical variations registered by ABC ARBITRAGE:
Near a new HIGH record (1st january)
Type : Bullish
Timeframe : Weekly
Near a new HIGH record (1 month)
Type : Bullish
Timeframe : Weekly
Technical
Technical analysis of this 1H chart of ABC ARBITRAGE indicates that the overall trend is strongly bullish. The signals given by the moving averages are 82.14% bullish. This strong bullish trend is confirmed by the strong signals currently being given by short-term moving averages. The Central Indicators market scanner currently does not detect any result that concerns moving averages.
An assessment of technical indicators shows a strong bullish signal.
But beware of excesses. The Central Indicators scanner currently detects this:
CCI indicator is overbought : over 100
Type : Neutral
Timeframe : 1 hour
Williams %R indicator is overbought : over -20
Type : Neutral
Timeframe : 1 hour
Pivot points : price is over resistance 3
Type : Neutral
Timeframe : 1 hour
Price is back over the pivot point
Type : Bullish
Timeframe : Weekly
An analysis of the price chart with the Central Patterns scanner (detector of chart patterns and resistances and supports) shows several results that can have an impact on the price change:
Near horizontal resistance
Type : Bearish
Timeframe : 1 hour
Near resistance of channel
Type : Bearish
Timeframe : 1 hour
No result was found by the Central Candlesticks scanner on Japanese candlesticks.
| S3 | S2 | S1 | Price | R1 | R2 | R3 | |
|---|---|---|---|---|---|---|---|
| ProTrendLines | 4.272 | 4.375 | 4.450 | 4.520 | 4.565 | 4.797 | 5.580 |
| Change (%) | -5.49% | -3.21% | -1.55% | - | +1.00% | +6.13% | +23.45% |
| Change | -0.248 | -0.145 | -0.070 | - | +0.045 | +0.277 | +1.060 |
| Level | Major | Major | Intermediate | - | Major | Intermediate | Intermediate |
Attention could also be paid to pivot points to set price objectives:
| Pivot points | S3 | S2 | S1 | PP | R1 | R2 | R3 |
|---|---|---|---|---|---|---|---|
| Standard | 4.407 | 4.433 | 4.482 | 4.508 | 4.557 | 4.583 | 4.632 |
| Camarilla | 4.509 | 4.516 | 4.523 | 4.530 | 4.537 | 4.544 | 4.551 |
| Woodie | 4.418 | 4.439 | 4.493 | 4.514 | 4.568 | 4.589 | 4.643 |
| Fibonacci | 4.433 | 4.462 | 4.480 | 4.508 | 4.537 | 4.555 | 4.583 |
| Pivot points | S3 | S2 | S1 | PP | R1 | R2 | R3 |
|---|---|---|---|---|---|---|---|
| Standard | 4.288 | 4.372 | 4.428 | 4.512 | 4.568 | 4.652 | 4.708 |
| Camarilla | 4.447 | 4.459 | 4.472 | 4.485 | 4.498 | 4.511 | 4.524 |
| Woodie | 4.275 | 4.365 | 4.415 | 4.505 | 4.555 | 4.645 | 4.695 |
| Fibonacci | 4.372 | 4.425 | 4.458 | 4.512 | 4.565 | 4.598 | 4.652 |
| Pivot points | S3 | S2 | S1 | PP | R1 | R2 | R3 |
|---|---|---|---|---|---|---|---|
| Standard | 3.700 | 3.835 | 4.090 | 4.225 | 4.480 | 4.615 | 4.870 |
| Camarilla | 4.238 | 4.274 | 4.309 | 4.345 | 4.381 | 4.417 | 4.452 |
| Woodie | 3.760 | 3.865 | 4.150 | 4.255 | 4.540 | 4.645 | 4.930 |
| Fibonacci | 3.835 | 3.984 | 4.076 | 4.225 | 4.374 | 4.466 | 4.615 |
Numerical data
The following is the status of technical indicators and moving averages registered at the time this technical analysis was created:
| RSI (14): | 62.68 | |
| MACD (12,26,9): | 0.0090 | |
| Directional Movement: | 23.840 | |
| AROON (14): | 71.429 | |
| DEMA (21): | 4.503 | |
| Parabolic SAR (0,02-0,02-0,2): | 4.465 | |
| Elder Ray (13): | 0.022 | |
| Super Trend (3,10): | 4.467 | |
| Zig ZAG (10): | 4.530 | |
| VORTEX (21): | 1.0250 | |
| Stochastique (14,3,5): | 86.28 | |
| TEMA (21): | 4.513 | |
| Williams %R (14): | -5.88 | |
| Chande Momentum Oscillator (20): | 0.065 | |
| Repulse (5,40,3): | 0.5370 | |
| ROCnROLL: | 1 | |
| TRIX (15,9): | -0.0050 | |
| Courbe Coppock: | 2.19 |
| MA7: | 4.512 | |
| MA20: | 4.379 | |
| MA50: | 4.208 | |
| MA100: | 4.158 | |
| MAexp7: | 4.513 | |
| MAexp20: | 4.495 | |
| MAexp50: | 4.484 | |
| MAexp100: | 4.447 | |
| Price / MA7: | +0.18% | |
| Price / MA20: | +3.22% | |
| Price / MA50: | +7.41% | |
| Price / MA100: | +8.71% | |
| Price / MAexp7: | +0.16% | |
| Price / MAexp20: | +0.56% | |
| Price / MAexp50: | +0.80% | |
| Price / MAexp100: | +1.64% |
News
Don't forget to follow the news on ABC ARBITRAGE. At the time of publication of this analysis, the latest news was as follows:
- ABC arbitrage : General meeting of June 7 2024
- ABC arbitrage: Release of the annual financial report as at December 31, 2023
- Half-year liquidity contract statement for ABC ARBITRAGE
- ABC arbitrage: First Semester Financial report (V2)
- ABC arbitrage : Release of the half-yearly financial report as at 30 June 2023
About author
Online


Add a comment
Comments
0 comments on the analysis ABC ARBITRAGE - 1H