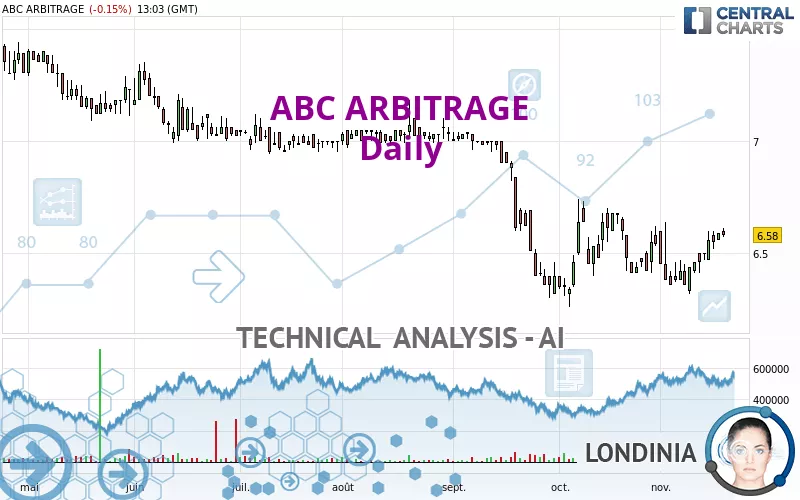
ABC ARBITRAGE - Daily - Technical analysis published on 11/18/2022 (GMT)
- 269
- 0
Click here for a new analysis!
- Timeframe : Daily
- - Analysis generated on
- Status : TARGET REACHED

Summary of the analysis

Additional analysis
Quotes
The ABC ARBITRAGE rating is 6.58 EUR. On the day, this instrument lost -0.15% and was traded between 6.57 EUR and 6.61 EUR over the period. The price is currently at +0.15% from its lowest and -0.45% from its highest.The Central Gaps scanner detects the formation of a bullish gap marking the strong presence of buyers against sellers at the opening. This formed a quotation gap.
Opening Gap UP
Type : Bullish
Timeframe : Openning
So that you have an overall view of the price change, here is a table showing the variations over several periods:
Near a new LOW record (1 month)
Type : Bearish
Timeframe : Weekly
Technical
A technical analysis in Daily of this ABC ARBITRAGE chart shows a slightly bearish trend. 57.14% of the signals given by moving averages are bearish. Caution: the strong bullish signals currently being given by short-term moving averages indicate that this slightly bearish trend could quickly be reversed. The Central Indicators scanner does not detect any result on moving averages that would impact this trend.
The probability of a further increase is high given the direction of the technical indicators.
Caution: the Central Indicators scanner currently detects an excess:
CCI indicator is overbought : over 100
Type : Neutral
Timeframe : Daily
Williams %R indicator is overbought : over -20
Type : Neutral
Timeframe : Daily
Pivot points : price is over resistance 1
Type : Neutral
Timeframe : Weekly
Central Patterns, the market scanner focusing on chart patterns, resistances and supports found this result:
Resistance of channel is broken
Type : Bullish
Timeframe : Daily
No result was found by the Central Candlesticks scanner on Japanese candlesticks.
| S3 | S2 | S1 | Price | R1 | R2 | R3 | |
|---|---|---|---|---|---|---|---|
| ProTrendLines | 6.24 | 6.36 | 6.55 | 6.58 | 6.69 | 6.81 | 7.01 |
| Change (%) | -5.17% | -3.34% | -0.46% | - | +1.67% | +3.50% | +6.53% |
| Change | -0.34 | -0.22 | -0.03 | - | +0.11 | +0.23 | +0.43 |
| Level | Major | Intermediate | Minor | - | Major | Intermediate | Intermediate |
Pivot points can also be used to set your price objectives. Here is the price situation in relation to pivot points:
| Pivot points | S3 | S2 | S1 | PP | R1 | R2 | R3 |
|---|---|---|---|---|---|---|---|
| Standard | 6.54 | 6.55 | 6.57 | 6.58 | 6.60 | 6.61 | 6.63 |
| Camarilla | 6.58 | 6.59 | 6.59 | 6.59 | 6.59 | 6.60 | 6.60 |
| Woodie | 6.55 | 6.55 | 6.58 | 6.58 | 6.61 | 6.61 | 6.64 |
| Fibonacci | 6.55 | 6.56 | 6.57 | 6.58 | 6.59 | 6.60 | 6.61 |
| Pivot points | S3 | S2 | S1 | PP | R1 | R2 | R3 |
|---|---|---|---|---|---|---|---|
| Standard | 6.17 | 6.25 | 6.35 | 6.43 | 6.53 | 6.61 | 6.71 |
| Camarilla | 6.41 | 6.43 | 6.44 | 6.46 | 6.48 | 6.49 | 6.51 |
| Woodie | 6.19 | 6.26 | 6.37 | 6.44 | 6.55 | 6.62 | 6.73 |
| Fibonacci | 6.25 | 6.32 | 6.36 | 6.43 | 6.50 | 6.54 | 6.61 |
| Pivot points | S3 | S2 | S1 | PP | R1 | R2 | R3 |
|---|---|---|---|---|---|---|---|
| Standard | 5.71 | 5.94 | 6.24 | 6.47 | 6.77 | 7.00 | 7.30 |
| Camarilla | 6.39 | 6.44 | 6.49 | 6.54 | 6.59 | 6.64 | 6.69 |
| Woodie | 5.75 | 5.96 | 6.28 | 6.49 | 6.81 | 7.02 | 7.34 |
| Fibonacci | 5.94 | 6.14 | 6.27 | 6.47 | 6.67 | 6.80 | 7.00 |
Numerical data
The following is the status of the technical indicators and moving averages at the time of publication of this technical analysis:
| RSI (14): | 57.05 | |
| MACD (12,26,9): | 0.0100 | |
| Directional Movement: | 6.16 | |
| AROON (14): | -35.71 | |
| DEMA (21): | 6.50 | |
| Parabolic SAR (0,02-0,02-0,2): | 6.34 | |
| Elder Ray (13): | 0.08 | |
| Super Trend (3,10): | 6.33 | |
| Zig ZAG (10): | 6.58 | |
| VORTEX (21): | 0.9700 | |
| Stochastique (14,3,5): | 79.17 | |
| TEMA (21): | 6.54 | |
| Williams %R (14): | -18.75 | |
| Chande Momentum Oscillator (20): | 0.20 | |
| Repulse (5,40,3): | 0.3100 | |
| ROCnROLL: | 1 | |
| TRIX (15,9): | -0.0300 | |
| Courbe Coppock: | 1.84 |
| MA7: | 6.53 | |
| MA20: | 6.47 | |
| MA50: | 6.50 | |
| MA100: | 6.70 | |
| MAexp7: | 6.53 | |
| MAexp20: | 6.50 | |
| MAexp50: | 6.55 | |
| MAexp100: | 6.65 | |
| Price / MA7: | +0.77% | |
| Price / MA20: | +1.70% | |
| Price / MA50: | +1.23% | |
| Price / MA100: | -1.79% | |
| Price / MAexp7: | +0.77% | |
| Price / MAexp20: | +1.23% | |
| Price / MAexp50: | +0.46% | |
| Price / MAexp100: | -1.05% |
News
The latest news and videos published on ABC ARBITRAGE at the time of the analysis were as follows:
- ABC arbitrage: 2022 Interim Result: : €16.2m / 2022 annualized ROE: 20.2 %
- ABC arbitrage Purchase of a block of shares for the group's employee equity incentive programs
- ABC arbitrage: Combined General Meeting 10 June 2022
- ABC arbitrage: Release of the annual financial report as at 31 december 2021
- ABC arbitrage: Share ownership evolution with no significant impact
About author
Online


Add a comment
Comments
0 comments on the analysis ABC ARBITRAGE - Daily