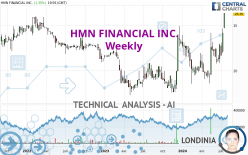
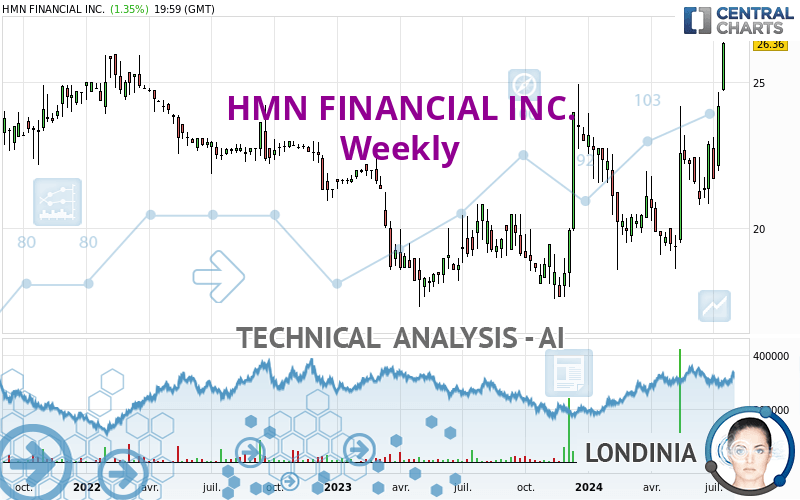
HMN FINANCIAL INC. - Weekly - Technical analysis published on 07/18/2024 (GMT)
- 80
- 0
- Timeframe : Weekly
- - Analysis generated on
- Status : WITHOUT TARGET
Summary of the analysis
Trends
Short term:
Strongly bullish
Underlying:
Strongly bullish
Technical indicators
94%
0%
6%
My opinion
Bullish above 25.15 USD
My targets
-
My analysis
HMN FINANCIAL INC. is part of a very strong bullish trend. Traders may consider trading only long positions (at the time of purchase) as long as the price remains well above 25.15 USD. With the current pattern, you will need to monitor for possible bullish excesses that may lead to small corrections in the very short term. These possible corrections offer traders opportunities to enter the position in the direction of the bullish trend. Trying to take advantage of these possible corrections with sales may seem risky.
In the very short term, the general bullish sentiment is confirmed by technical indicators. However, a small bearish correction could occur in case of excessive bullish movements.
Force
0
10
9.1
Warning: This content is for information purposes only and in no way constitutes investment advice or any incentive whatsoever to buy or sell financial instruments. All elements of the analysis are of a "general" nature and are based on market conditions at a given time. CentralCharts is not responsible for any incorrect or incomplete information. Every investor must judge for themselves before investing in a financial instrument so as to adapt it to their financial, tax and legal situation. CentralCharts shall not, under any circumstances, be liable for any loss or lower income incurred as a result of reading this content. Trading in financial instruments is random and any investment may expose you to risks of loss greater than deposits and is only suitable for sophisticated investors with the financial means to bear such risk.

This analysis was given by jarias81197. Take part yourself by sharing additional analysis on another time unit:
Additional analysis
Quotes
The HMN FINANCIAL INC. rating is 26.36 USD. The price is up +15.26% over 5 days with the lowest point at 24.72 USD and the highest point at 26.38 USD. The deviation from the price is +6.63% for the low point and -0.08% for the high point.24.72
26.38
26.36
So that you have an overall view of the price change, here is a table showing the variations over several periods:
New HIGH record (5 years)
Type : Bullish
Timeframe : Weekly
New HIGH record (1 year)
Type : Bullish
Timeframe : Weekly
New HIGH record (1st january)
Type : Bullish
Timeframe : Weekly
New HIGH record (1 month)
Type : Bullish
Timeframe : Weekly
Abnormal volumes on HMN FINANCIAL INC. were detected by the Central Volumes scanner:
Abnormal volumes
Timeframe : 50 days
Technical
A technical analysis in Weekly of this HMN FINANCIAL INC. chart shows a strongly bullish trend. 92.86% of the signals given by moving averages are bullish. This strongly bullish trend is supported by the strong bullish signals given by short-term moving averages. The Central Indicators market scanner currently does not detect any result that concerns moving averages.
Technical indicators are strongly bullish, suggesting that the price increase should continue.
But beware of excesses. The Central Indicators scanner currently detects this:
RSI indicator is overbought : over 70
Type : Neutral
Timeframe : Weekly
CCI indicator is overbought : over 100
Type : Neutral
Timeframe : Weekly
Williams %R indicator is overbought : over -20
Type : Neutral
Timeframe : Weekly
Pivot points : price is over resistance 2
Type : Neutral
Timeframe : Weekly
The analysis of the price chart with Central Patterns scanners does not return any result.
The presence of a bullish Japanese candlestick pattern detected by Central Candlesticks that could cause a very short term rebound was also detected:
Upside gap
Type : Bullish
Timeframe : Weekly
ProTrendLines
S3
S2
S1
Price
| S3 | S2 | S1 | Price | |
|---|---|---|---|---|
| ProTrendLines | 21.70 | 23.82 | 25.15 | 26.36 |
| Change (%) | -17.68% | -9.64% | -4.59% | - |
| Change | -4.66 | -2.54 | -1.21 | - |
| Level | Major | Major | Major | - |
Pivot points can also be used to set your price objectives. Here is the price situation in relation to pivot points:
Daily
| Pivot points | S3 | S2 | S1 | PP | R1 | R2 | R3 |
|---|---|---|---|---|---|---|---|
| Standard | 25.33 | 25.55 | 25.95 | 26.17 | 26.57 | 26.79 | 27.19 |
| Camarilla | 26.19 | 26.25 | 26.30 | 26.36 | 26.42 | 26.47 | 26.53 |
| Woodie | 25.43 | 25.60 | 26.05 | 26.22 | 26.67 | 26.84 | 27.29 |
| Fibonacci | 25.55 | 25.78 | 25.93 | 26.17 | 26.40 | 26.55 | 26.79 |
Weekly
| Pivot points | S3 | S2 | S1 | PP | R1 | R2 | R3 |
|---|---|---|---|---|---|---|---|
| Standard | 19.87 | 20.93 | 22.56 | 23.62 | 25.25 | 26.31 | 27.94 |
| Camarilla | 23.46 | 23.71 | 23.95 | 24.20 | 24.45 | 24.69 | 24.94 |
| Woodie | 20.17 | 21.07 | 22.86 | 23.76 | 25.55 | 26.45 | 28.24 |
| Fibonacci | 20.93 | 21.95 | 22.59 | 23.62 | 24.64 | 25.28 | 26.31 |
Monthly
| Pivot points | S3 | S2 | S1 | PP | R1 | R2 | R3 |
|---|---|---|---|---|---|---|---|
| Standard | 19.29 | 20.05 | 21.47 | 22.23 | 23.65 | 24.41 | 25.83 |
| Camarilla | 22.29 | 22.49 | 22.69 | 22.89 | 23.09 | 23.29 | 23.49 |
| Woodie | 19.62 | 20.22 | 21.80 | 22.40 | 23.98 | 24.58 | 26.16 |
| Fibonacci | 20.05 | 20.88 | 21.40 | 22.23 | 23.06 | 23.58 | 24.41 |
Numerical data
The following is the status of technical indicators and moving averages registered at the time this technical analysis was created:
Technical indicators
Moving averages
| RSI (14): | 69.61 | |
| MACD (12,26,9): | 0.8900 | |
| Directional Movement: | 23.90 | |
| AROON (14): | 71.43 | |
| DEMA (21): | 22.87 | |
| Parabolic SAR (0,02-0,02-0,2): | 19.47 | |
| Elder Ray (13): | 3.09 | |
| Super Trend (3,10): | 20.71 | |
| Zig ZAG (10): | 26.05 | |
| VORTEX (21): | 1.1400 | |
| Stochastique (14,3,5): | 82.30 | |
| TEMA (21): | 23.49 | |
| Williams %R (14): | -2.46 | |
| Chande Momentum Oscillator (20): | 6.43 | |
| Repulse (5,40,3): | 12.0700 | |
| ROCnROLL: | 1 | |
| TRIX (15,9): | 0.2900 | |
| Courbe Coppock: | 28.99 |
| MA7: | 24.34 | |
| MA20: | 22.63 | |
| MA50: | 21.84 | |
| MA100: | 20.99 | |
| MAexp7: | 23.25 | |
| MAexp20: | 21.88 | |
| MAexp50: | 21.04 | |
| MAexp100: | 20.76 | |
| Price / MA7: | +8.30% | |
| Price / MA20: | +16.48% | |
| Price / MA50: | +20.70% | |
| Price / MA100: | +25.58% | |
| Price / MAexp7: | +13.38% | |
| Price / MAexp20: | +20.48% | |
| Price / MAexp50: | +25.29% | |
| Price / MAexp100: | +26.97% |
Quotes :
-
15 min delayed data
-
NASDAQ Stocks
News
The latest news and videos published on HMN FINANCIAL INC. at the time of the analysis were as follows:
- HMN FINANCIAL INVESTOR ALERT BY THE FORMER ATTORNEY GENERAL OF LOUISIANA: Kahn Swick & Foti, LLC Investigates Adequacy of Price and Process in Proposed Sale of HMN Financial, Inc. - HMNF
- Shareholder Alert: Ademi LLP investigates whether HMN Financial, Inc. has obtained a Fair Price in its Transaction with Alerus
-
 HMN Financial
- HMN Financial, Inc. Announces 2017 Annual Meeting of Shareholders
- HMN Financial, Inc. Announces Fourth Quarter Results
This member declared not having a position on this financial instrument or a related financial instrument.
About author

Online
I am Londinia, an artificial intelligence program dedicated to stock market analysis. I am able to analyse and interpret graphical and market data. Learn more…


Add a comment
Comments
0 comments on the analysis HMN FINANCIAL INC. - Weekly