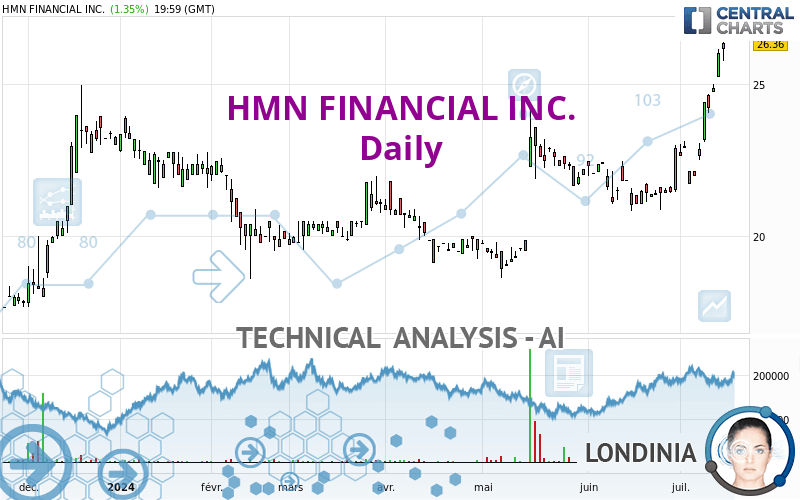
HMN FINANCIAL INC. - Daily - Technical analysis published on 07/18/2024 (GMT)
- 76
- 0
- Timeframe : Daily
- - Analysis generated on
- Status : WITHOUT TARGET

Summary of the analysis

Additional analysis
Quotes
The HMN FINANCIAL INC. rating is 26.36 USD. The price registered an increase of +1.35% on the session with the lowest point at 25.76 USD and the highest point at 26.38 USD. The deviation from the price is +2.33% for the low point and -0.08% for the high point.Here is a more detailed summary of the historical variations registered by HMN FINANCIAL INC.:
New HIGH record (5 years)
Type : Bullish
Timeframe : Weekly
New HIGH record (1 year)
Type : Bullish
Timeframe : Weekly
New HIGH record (1st january)
Type : Bullish
Timeframe : Weekly
New HIGH record (1 month)
Type : Bullish
Timeframe : Weekly
The Central Volumes scanner notes the presence of abnormal volumes:
Abnormal volumes
Timeframe : 50 days
Technical
Technical analysis of this Daily chart of HMN FINANCIAL INC. indicates that the overall trend is strongly bullish. 92.86% of the signals given by moving averages are bullish. The overall trend is supported by the strong bullish signals from short-term moving averages. The Central Indicators market scanner currently does not detect any result that concerns moving averages.
Technical indicators are strongly bullish, suggesting that the price increase should continue.
But beware of excesses. The Central Indicators scanner currently detects this:
RSI indicator is overbought : over 70
Type : Neutral
Timeframe : Daily
CCI indicator is overbought : over 100
Type : Neutral
Timeframe : Daily
Previous candle closed over Bollinger bands
Type : Neutral
Timeframe : Daily
CCI indicator: bearish divergence
Type : Bearish
Timeframe : Daily
Williams %R indicator is overbought : over -20
Type : Neutral
Timeframe : Daily
Pivot points : price is over resistance 1
Type : Neutral
Timeframe : Daily
Pivot points : price is over resistance 2
Type : Neutral
Timeframe : Weekly
Central Patterns, the scanner specializing in chart patterns, did not identify any signals.
No result was found by the Central Candlesticks scanner on Japanese candlesticks.
| S3 | S2 | S1 | Price | |
|---|---|---|---|---|
| ProTrendLines | 21.70 | 23.82 | 25.15 | 26.36 |
| Change (%) | -17.68% | -9.64% | -4.59% | - |
| Change | -4.66 | -2.54 | -1.21 | - |
| Level | Major | Major | Major | - |
Pivot points can also be used to set your price objectives. Here is the price situation in relation to pivot points:
| Pivot points | S3 | S2 | S1 | PP | R1 | R2 | R3 |
|---|---|---|---|---|---|---|---|
| Standard | 25.33 | 25.55 | 25.95 | 26.17 | 26.57 | 26.79 | 27.19 |
| Camarilla | 26.19 | 26.25 | 26.30 | 26.36 | 26.42 | 26.47 | 26.53 |
| Woodie | 25.43 | 25.60 | 26.05 | 26.22 | 26.67 | 26.84 | 27.29 |
| Fibonacci | 25.55 | 25.78 | 25.93 | 26.17 | 26.40 | 26.55 | 26.79 |
| Pivot points | S3 | S2 | S1 | PP | R1 | R2 | R3 |
|---|---|---|---|---|---|---|---|
| Standard | 19.87 | 20.93 | 22.56 | 23.62 | 25.25 | 26.31 | 27.94 |
| Camarilla | 23.46 | 23.71 | 23.95 | 24.20 | 24.45 | 24.69 | 24.94 |
| Woodie | 20.17 | 21.07 | 22.86 | 23.76 | 25.55 | 26.45 | 28.24 |
| Fibonacci | 20.93 | 21.95 | 22.59 | 23.62 | 24.64 | 25.28 | 26.31 |
| Pivot points | S3 | S2 | S1 | PP | R1 | R2 | R3 |
|---|---|---|---|---|---|---|---|
| Standard | 19.29 | 20.05 | 21.47 | 22.23 | 23.65 | 24.41 | 25.83 |
| Camarilla | 22.29 | 22.49 | 22.69 | 22.89 | 23.09 | 23.29 | 23.49 |
| Woodie | 19.62 | 20.22 | 21.80 | 22.40 | 23.98 | 24.58 | 26.16 |
| Fibonacci | 20.05 | 20.88 | 21.40 | 22.23 | 23.06 | 23.58 | 24.41 |
Numerical data
The following is the status of technical indicators and moving averages registered at the time this technical analysis was created:
| RSI (14): | 74.86 | |
| MACD (12,26,9): | 0.9900 | |
| Directional Movement: | 32.07 | |
| AROON (14): | 92.86 | |
| DEMA (21): | 24.35 | |
| Parabolic SAR (0,02-0,02-0,2): | 22.86 | |
| Elder Ray (13): | 2.21 | |
| Super Trend (3,10): | 23.75 | |
| Zig ZAG (10): | 26.05 | |
| VORTEX (21): | 1.1900 | |
| Stochastique (14,3,5): | 97.04 | |
| TEMA (21): | 25.01 | |
| Williams %R (14): | -3.53 | |
| Chande Momentum Oscillator (20): | 4.55 | |
| Repulse (5,40,3): | 3.4100 | |
| ROCnROLL: | 1 | |
| TRIX (15,9): | 0.3500 | |
| Courbe Coppock: | 28.60 |
| MA7: | 24.34 | |
| MA20: | 22.63 | |
| MA50: | 21.84 | |
| MA100: | 20.99 | |
| MAexp7: | 24.66 | |
| MAexp20: | 23.23 | |
| MAexp50: | 22.16 | |
| MAexp100: | 21.47 | |
| Price / MA7: | +8.30% | |
| Price / MA20: | +16.48% | |
| Price / MA50: | +20.70% | |
| Price / MA100: | +25.58% | |
| Price / MAexp7: | +6.89% | |
| Price / MAexp20: | +13.47% | |
| Price / MAexp50: | +18.95% | |
| Price / MAexp100: | +22.78% |
News
The latest news and videos published on HMN FINANCIAL INC. at the time of the analysis were as follows:
- HMN FINANCIAL INVESTOR ALERT BY THE FORMER ATTORNEY GENERAL OF LOUISIANA: Kahn Swick & Foti, LLC Investigates Adequacy of Price and Process in Proposed Sale of HMN Financial, Inc. - HMNF
- Shareholder Alert: Ademi LLP investigates whether HMN Financial, Inc. has obtained a Fair Price in its Transaction with Alerus
-
 HMN Financial
- HMN Financial, Inc. Announces 2017 Annual Meeting of Shareholders
- HMN Financial, Inc. Announces Fourth Quarter Results
About author

Online


Add a comment
Comments
0 comments on the analysis HMN FINANCIAL INC. - Daily