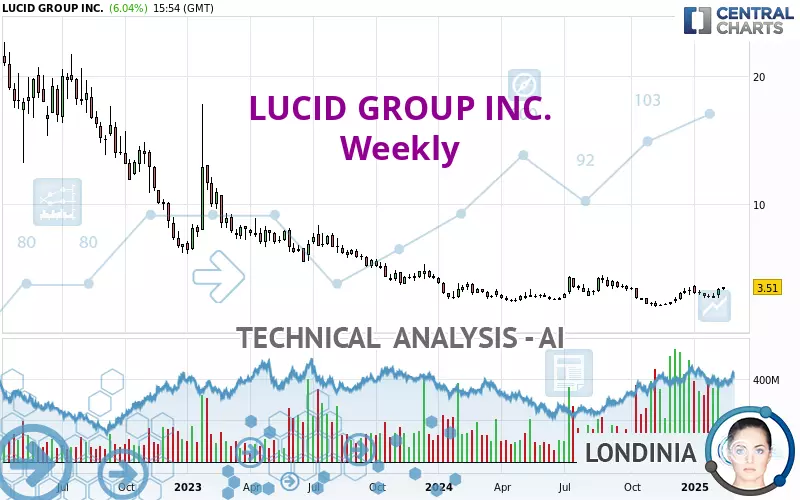
LUCID GROUP INC. - Weekly - Technical analysis published on 02/18/2025 (GMT)
- 61
- 0
- Timeframe : Weekly
- - Analysis generated on
- Status : NEUTRAL

Summary of the analysis

Additional analysis
Quotes
The LUCID GROUP INC. rating is 3.51 USD. Over 5 days, this instrument gained +30.48% and has been traded over the last 5 days between 3.24 USD and 3.52 USD. This implies that the 5 day price is +8.33% from its lowest point and -0.28% from its highest point.A bearish opening was detected by the Central Gaps scanner. Sellers are trying to impose a bearish trend in the very short term.
Bearish opening
Type : Bearish
Timeframe : Openning
Here is a more detailed summary of the historical variations registered by LUCID GROUP INC.:
New HIGH record (1 month)
Type : Bullish
Timeframe : Weekly
Abnormal volumes on LUCID GROUP INC. were detected by the Central Volumes scanner:
Abnormal volumes
Timeframe : 50 days
Technical
Technical analysis of this Weekly chart of LUCID GROUP INC. indicates that the overall trend is slightly bearish. Only 53.57% of the signals given by moving averages are bearish. This slightly bearish trend could turn neutral or reverse given the slightly bullish signals currently being given by short-term moving averages. An assessment of moving averages reveals a bullish signal that could impact this trend:
Bullish trend reversal : adaptative moving average 20
Type : Bullish
Timeframe : Weekly
Technical indicators are strongly bullish, suggesting that the price increase should continue.
Caution: the Central Indicators scanner currently detects an excess:
CCI indicator is overbought : over 100
Type : Neutral
Timeframe : Weekly
Williams %R indicator is overbought : over -20
Type : Neutral
Timeframe : Weekly
MACD indicator is back over 0
Type : Bullish
Timeframe : Weekly
The analysis of the price chart with Central Patterns scanners does not return any result.
The Central Candlesticks scanner, specialised in Japanese candlesticks, did not identify any signals.
| S1 | Price | R1 | R2 | R3 | |
|---|---|---|---|---|---|
| ProTrendLines | 2.33 | 3.51 | 8.13 | 28.82 | 45.47 |
| Change (%) | -33.62% | - | +131.62% | +721.08% | +1,195.44% |
| Change | -1.18 | - | +4.62 | +25.31 | +41.96 |
| Level | Intermediate | - | Minor | Minor | Minor |
Pivot points can also be used to set your price objectives. Here is the price situation in relation to pivot points:
| Pivot points | S3 | S2 | S1 | PP | R1 | R2 | R3 |
|---|---|---|---|---|---|---|---|
| Standard | 3.10 | 3.18 | 3.25 | 3.33 | 3.40 | 3.48 | 3.55 |
| Camarilla | 3.27 | 3.28 | 3.30 | 3.31 | 3.32 | 3.34 | 3.35 |
| Woodie | 3.09 | 3.18 | 3.24 | 3.33 | 3.39 | 3.48 | 3.54 |
| Fibonacci | 3.18 | 3.24 | 3.28 | 3.33 | 3.39 | 3.43 | 3.48 |
| Pivot points | S3 | S2 | S1 | PP | R1 | R2 | R3 |
|---|---|---|---|---|---|---|---|
| Standard | 2.10 | 2.38 | 2.85 | 3.13 | 3.60 | 3.88 | 4.35 |
| Camarilla | 3.10 | 3.17 | 3.24 | 3.31 | 3.38 | 3.45 | 3.52 |
| Woodie | 2.19 | 2.43 | 2.94 | 3.18 | 3.69 | 3.93 | 4.44 |
| Fibonacci | 2.38 | 2.67 | 2.85 | 3.13 | 3.42 | 3.60 | 3.88 |
| Pivot points | S3 | S2 | S1 | PP | R1 | R2 | R3 |
|---|---|---|---|---|---|---|---|
| Standard | 1.34 | 1.97 | 2.37 | 3.00 | 3.40 | 4.03 | 4.43 |
| Camarilla | 2.48 | 2.57 | 2.67 | 2.76 | 2.85 | 2.95 | 3.04 |
| Woodie | 1.22 | 1.91 | 2.25 | 2.94 | 3.28 | 3.97 | 4.31 |
| Fibonacci | 1.97 | 2.37 | 2.61 | 3.00 | 3.40 | 3.64 | 4.03 |
Numerical data
The following are the details of the technical indicators and moving averages that were collected to generate this technical analysis:
| RSI (14): | 56.92 | |
| MACD (12,26,9): | 0.0200 | |
| Directional Movement: | 10.16 | |
| AROON (14): | 57.14 | |
| DEMA (21): | 2.93 | |
| Parabolic SAR (0,02-0,02-0,2): | 2.64 | |
| Elder Ray (13): | 0.35 | |
| Super Trend (3,10): | 3.46 | |
| Zig ZAG (10): | 3.38 | |
| VORTEX (21): | 0.9800 | |
| Stochastique (14,3,5): | 72.60 | |
| TEMA (21): | 3.09 | |
| Williams %R (14): | -15.54 | |
| Chande Momentum Oscillator (20): | 1.21 | |
| Repulse (5,40,3): | 14.6600 | |
| ROCnROLL: | -1 | |
| TRIX (15,9): | -0.3400 | |
| Courbe Coppock: | 59.87 |
| MA7: | 3.03 | |
| MA20: | 2.87 | |
| MA50: | 2.86 | |
| MA100: | 2.76 | |
| MAexp7: | 3.08 | |
| MAexp20: | 2.95 | |
| MAexp50: | 3.34 | |
| MAexp100: | 5.38 | |
| Price / MA7: | +15.84% | |
| Price / MA20: | +22.30% | |
| Price / MA50: | +22.73% | |
| Price / MA100: | +27.17% | |
| Price / MAexp7: | +13.96% | |
| Price / MAexp20: | +18.98% | |
| Price / MAexp50: | +5.09% | |
| Price / MAexp100: | -34.76% |
News
The last news published on LUCID GROUP INC. at the time of the generation of this analysis was as follows:
About author

Online


Add a comment
Comments
0 comments on the analysis LUCID GROUP INC. - Weekly