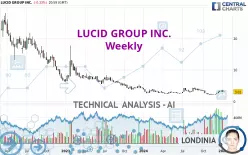
LUCID GROUP INC. - Weekly - Technical analysis published on 01/14/2025 (GMT)
- 111
- 0
Click here for a new analysis!
- Timeframe : Weekly
- - Analysis generated on
- Status : TARGET REACHED

Summary of the analysis

Additional analysis
Quotes
LUCID GROUP INC. rating 3.01 USD. The price registered a decrease of -5.35% over 5 days and was traded between 2.85 USD and 3.10 USD over the period. The price is currently at +5.61% from its lowest point and -2.90% from its highest point.So that you have an overall view of the price change, here is a table showing the variations over several periods:
New LOW record (1st january)
Type : Bearish
Timeframe : Weekly
Abnormal volumes on LUCID GROUP INC. were detected by the Central Volumes scanner:
Abnormal volumes
Timeframe : 5 days
Abnormal volumes
Timeframe : 20 days
Abnormal volumes
Timeframe : 50 days
Technical
Technical analysis of LUCID GROUP INC. in Weekly shows an overall bearish trend. The signals given by moving averages are at 71.43% bearish. This bearish trend could slow down given the slightly bullish signals currently being given by short-term moving averages. An assessment of moving averages reveals several bearish and bullish signals:
Bearish trend reversal : Moving Average 20
Type : Bearish
Timeframe : Weekly
Moving Average bullish crossovers : AMA50 & AMA100
Type : Bullish
Timeframe : Weekly
In fact, 11 technical indicators on 18 studied are currently bullish. Central Indicators, the scanner specialised in technical indicators, has identified this signal:
Aroon indicator bullish trend
Type : Bullish
Timeframe : Weekly
The analysis of the price chart with Central Patterns scanners does not return any result.
For a small rebound in the very short term, the Central Candlesticks scanner currently notes the presence of this bullish pattern in Japanese candlesticks:
Bullish doji star
Type : Bullish
Timeframe : Weekly
| S1 | Price | R1 | R2 | R3 | |
|---|---|---|---|---|---|
| ProTrendLines | 2.37 | 3.01 | 17.52 | 28.82 | 45.47 |
| Change (%) | -21.26% | - | +482.06% | +857.48% | +1,410.63% |
| Change | -0.64 | - | +14.51 | +25.81 | +42.46 |
| Level | Major | - | Minor | Minor | Minor |
Attention could also be paid to pivot points to set price objectives:
| Pivot points | S3 | S2 | S1 | PP | R1 | R2 | R3 |
|---|---|---|---|---|---|---|---|
| Standard | 2.72 | 2.78 | 2.90 | 2.96 | 3.08 | 3.14 | 3.26 |
| Camarilla | 2.96 | 2.98 | 2.99 | 3.01 | 3.03 | 3.04 | 3.06 |
| Woodie | 2.74 | 2.80 | 2.92 | 2.98 | 3.10 | 3.16 | 3.28 |
| Fibonacci | 2.78 | 2.85 | 2.90 | 2.96 | 3.03 | 3.08 | 3.14 |
| Pivot points | S3 | S2 | S1 | PP | R1 | R2 | R3 |
|---|---|---|---|---|---|---|---|
| Standard | 1.99 | 2.45 | 2.73 | 3.19 | 3.47 | 3.93 | 4.21 |
| Camarilla | 2.82 | 2.88 | 2.95 | 3.02 | 3.09 | 3.16 | 3.22 |
| Woodie | 1.91 | 2.41 | 2.65 | 3.15 | 3.39 | 3.89 | 4.13 |
| Fibonacci | 2.45 | 2.73 | 2.90 | 3.19 | 3.47 | 3.64 | 3.93 |
| Pivot points | S3 | S2 | S1 | PP | R1 | R2 | R3 |
|---|---|---|---|---|---|---|---|
| Standard | 0.75 | 1.41 | 2.21 | 2.87 | 3.67 | 4.33 | 5.13 |
| Camarilla | 2.62 | 2.75 | 2.89 | 3.02 | 3.15 | 3.29 | 3.42 |
| Woodie | 0.83 | 1.45 | 2.29 | 2.91 | 3.75 | 4.37 | 5.21 |
| Fibonacci | 1.41 | 1.96 | 2.31 | 2.87 | 3.42 | 3.77 | 4.33 |
Numerical data
The following is the status of technical indicators and moving averages registered at the time this technical analysis was created:
| RSI (14): | 51.11 | |
| MACD (12,26,9): | -0.0700 | |
| Directional Movement: | 9.47 | |
| AROON (14): | 57.15 | |
| DEMA (21): | 2.76 | |
| Parabolic SAR (0,02-0,02-0,2): | 2.23 | |
| Elder Ray (13): | 0.08 | |
| Super Trend (3,10): | 3.46 | |
| Zig ZAG (10): | 3.01 | |
| VORTEX (21): | 0.9700 | |
| Stochastique (14,3,5): | 68.36 | |
| TEMA (21): | 2.88 | |
| Williams %R (14): | -36.84 | |
| Chande Momentum Oscillator (20): | 0.51 | |
| Repulse (5,40,3): | -4.0900 | |
| ROCnROLL: | -1 | |
| TRIX (15,9): | -0.6700 | |
| Courbe Coppock: | 16.54 |
| MA7: | 3.12 | |
| MA20: | 2.98 | |
| MA50: | 2.51 | |
| MA100: | 2.97 | |
| MAexp7: | 2.93 | |
| MAexp20: | 2.89 | |
| MAexp50: | 3.41 | |
| MAexp100: | 5.63 | |
| Price / MA7: | -3.53% | |
| Price / MA20: | +1.01% | |
| Price / MA50: | +19.92% | |
| Price / MA100: | +1.35% | |
| Price / MAexp7: | +2.73% | |
| Price / MAexp20: | +4.15% | |
| Price / MAexp50: | -11.73% | |
| Price / MAexp100: | -46.54% |
News
The last news published on LUCID GROUP INC. at the time of the generation of this analysis was as follows:
About author

Online


Add a comment
Comments
0 comments on the analysis LUCID GROUP INC. - Weekly