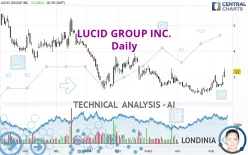
LUCID GROUP INC. - Daily - Technical analysis published on 05/14/2024 (GMT)
- 77
- 0
Click here for a new analysis!
- Timeframe : Daily
- - Analysis generated on
- Status : INVALID

Summary of the analysis

Additional analysis
Quotes
The LUCID GROUP INC. rating is 3.20 USD. The price has increased by +13.88% since the last closing with the lowest point at 2.98 USD and the highest point at 3.35 USD. The deviation from the price is +7.38% for the low point and -4.48% for the high point.The Central Gaps scanner detects a bullish opening marking the presence of buyers ahead of sellers at the opening but not sufficiently marked to allow the price to register a quotation gap.
Bullish opening
Type : Bullish
Timeframe : Openning
Here is a more detailed summary of the historical variations registered by LUCID GROUP INC.:
New HIGH record (1 month)
Type : Bullish
Timeframe : Weekly
Technical
Technical analysis of this Daily chart of LUCID GROUP INC. indicates that the overall trend is slightly bullish. 50.00% of the signals given by moving averages are bullish. The overall trend could accelerate as strong bullish signals from short-term moving averages are expected. The Central Indicators scanner detects bullish signals on moving averages that could impact this trend:
Bullish trend reversal : adaptative moving average 50
Type : Bullish
Timeframe : Daily
Bullish price crossover with Moving Average 100
Type : Bullish
Timeframe : Daily
Bullish price crossover with adaptative moving average 50
Type : Bullish
Timeframe : Daily
Bullish price crossover with adaptative moving average 100
Type : Bullish
Timeframe : Daily
In fact, 17 technical indicators on 18 studied are currently positioned bullish. Caution: the Central Indicators scanner currently detects an excess:
CCI indicator is overbought : over 100
Type : Neutral
Timeframe : Daily
Williams %R indicator is overbought : over -20
Type : Neutral
Timeframe : Daily
Pivot points : price is over resistance 1
Type : Neutral
Timeframe : Daily
Pivot points : price is over resistance 1
Type : Neutral
Timeframe : Weekly
The analysis of the price chart with Central Patterns scanners does not return any result.
The Central Candlesticks scanner which studies Japanese candlesticks did not detect anything.
| S1 | Price | R1 | R2 | R3 | |
|---|---|---|---|---|---|
| ProTrendLines | 2.65 | 3.20 | 3.73 | 5.13 | 6.38 |
| Change (%) | -17.19% | - | +16.56% | +60.31% | +99.38% |
| Change | -0.55 | - | +0.53 | +1.93 | +3.18 |
| Level | Major | - | Intermediate | Intermediate | Minor |
Pivot points can also be used to set your price objectives. Here is the price situation in relation to pivot points:
| Pivot points | S3 | S2 | S1 | PP | R1 | R2 | R3 |
|---|---|---|---|---|---|---|---|
| Standard | 2.25 | 2.46 | 2.64 | 2.85 | 3.03 | 3.24 | 3.42 |
| Camarilla | 2.70 | 2.74 | 2.77 | 2.81 | 2.85 | 2.88 | 2.92 |
| Woodie | 2.23 | 2.45 | 2.62 | 2.84 | 3.01 | 3.23 | 3.40 |
| Fibonacci | 2.46 | 2.61 | 2.70 | 2.85 | 3.00 | 3.09 | 3.24 |
| Pivot points | S3 | S2 | S1 | PP | R1 | R2 | R3 |
|---|---|---|---|---|---|---|---|
| Standard | 1.95 | 2.27 | 2.46 | 2.78 | 2.97 | 3.29 | 3.48 |
| Camarilla | 2.52 | 2.57 | 2.61 | 2.66 | 2.71 | 2.75 | 2.80 |
| Woodie | 1.90 | 2.24 | 2.41 | 2.75 | 2.92 | 3.26 | 3.43 |
| Fibonacci | 2.27 | 2.46 | 2.58 | 2.78 | 2.97 | 3.09 | 3.29 |
| Pivot points | S3 | S2 | S1 | PP | R1 | R2 | R3 |
|---|---|---|---|---|---|---|---|
| Standard | 1.64 | 1.96 | 2.26 | 2.58 | 2.88 | 3.20 | 3.50 |
| Camarilla | 2.38 | 2.44 | 2.49 | 2.55 | 2.61 | 2.66 | 2.72 |
| Woodie | 1.62 | 1.96 | 2.24 | 2.58 | 2.86 | 3.20 | 3.48 |
| Fibonacci | 1.96 | 2.20 | 2.35 | 2.58 | 2.82 | 2.97 | 3.20 |
Numerical data
The following is the status of technical indicators and moving averages registered at the time this technical analysis was created:
| RSI (14): | 65.81 | |
| MACD (12,26,9): | 0.0600 | |
| Directional Movement: | 23.12 | |
| AROON (14): | 78.57 | |
| DEMA (21): | 2.76 | |
| Parabolic SAR (0,02-0,02-0,2): | 2.60 | |
| Elder Ray (13): | 0.41 | |
| Super Trend (3,10): | 2.46 | |
| Zig ZAG (10): | 3.21 | |
| VORTEX (21): | 1.0200 | |
| Stochastique (14,3,5): | 63.89 | |
| TEMA (21): | 2.89 | |
| Williams %R (14): | -16.67 | |
| Chande Momentum Oscillator (20): | 0.73 | |
| Repulse (5,40,3): | 4.9800 | |
| ROCnROLL: | 1 | |
| TRIX (15,9): | -0.0100 | |
| Courbe Coppock: | 28.98 |
| MA7: | 2.82 | |
| MA20: | 2.63 | |
| MA50: | 2.72 | |
| MA100: | 3.09 | |
| MAexp7: | 2.84 | |
| MAexp20: | 2.72 | |
| MAexp50: | 2.81 | |
| MAexp100: | 3.20 | |
| Price / MA7: | +13.48% | |
| Price / MA20: | +21.67% | |
| Price / MA50: | +17.65% | |
| Price / MA100: | +3.56% | |
| Price / MAexp7: | +12.68% | |
| Price / MAexp20: | +17.65% | |
| Price / MAexp50: | +13.88% | |
| Price / MAexp100: | -0% |
News
The last news published on LUCID GROUP INC. at the time of the generation of this analysis was as follows:
About author

Online


Add a comment
Comments
0 comments on the analysis LUCID GROUP INC. - Daily