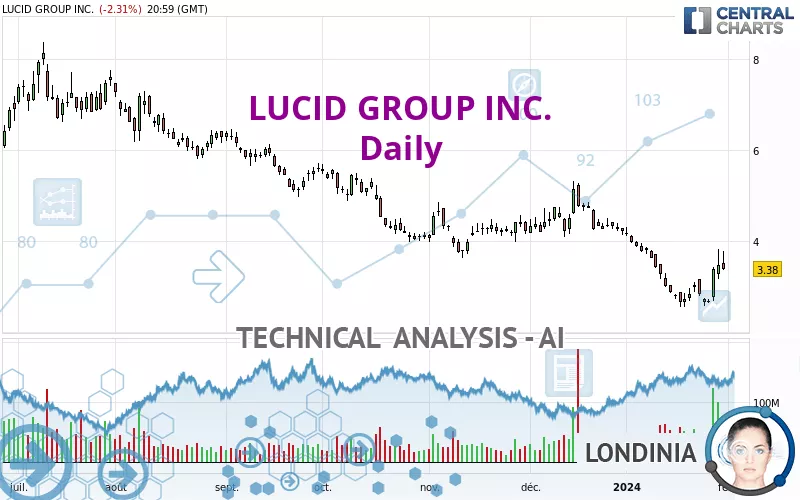
LUCID GROUP INC. - Daily - Technical analysis published on 02/01/2024 (GMT)
- 176
- 0
Click here for a new analysis!
- Timeframe : Daily
- - Analysis generated on
- Status : INVALID

Summary of the analysis

Additional analysis
Quotes
The LUCID GROUP INC. rating is 3.38 USD. On the day, this instrument lost -2.31% and was traded between 3.35 USD and 3.77 USD over the period. The price is currently at +0.90% from its lowest and -10.34% from its highest.The Central Gaps scanner detects a bullish opening. A small advantage for buyers in the very short term.
Bullish opening
Type : Bullish
Timeframe : Openning
Here is a more detailed summary of the historical variations registered by LUCID GROUP INC.:
Near a new LOW record (5 years)
Type : Bearish
Timeframe : Weekly
Abnormal volumes on LUCID GROUP INC. were detected by the Central Volumes scanner:
Abnormal volumes
Timeframe : 5 days
Technical
Technical analysis of this Daily chart of LUCID GROUP INC. indicates that the overall trend is bearish. The signals given by moving averages are 75.00% bearish. This bearish trend could slow down given the neutral signals currently being given by short-term moving averages. The Central Indicators market scanner currently does not detect any result that concerns moving averages.
In fact, 10 technical indicators on 18 studied are currently bullish. Central Indicators, the scanner specialised in technical indicators, has identified these signals:
Pivot points : price is over resistance 2
Type : Neutral
Timeframe : Weekly
RSI indicator is back under 50
Type : Bearish
Timeframe : Daily
Price is back under the pivot point
Type : Bearish
Timeframe : Daily
The Central Patterns scanner, which studies chart patterns, resistances and supports, has identified this signal:
Near resistance of channel
Type : Bearish
Timeframe : Daily
The Central Candlesticks scanner which studies Japanese candlesticks did not detect anything.
| S1 | Price | R1 | R2 | R3 | |
|---|---|---|---|---|---|
| ProTrendLines | 2.65 | 3.38 | 3.75 | 5.13 | 6.71 |
| Change (%) | -21.60% | - | +10.95% | +51.78% | +98.52% |
| Change | -0.73 | - | +0.37 | +1.75 | +3.33 |
| Level | Major | - | Intermediate | Intermediate | Minor |
Attention could also be paid to pivot points to set price objectives:
| Pivot points | S3 | S2 | S1 | PP | R1 | R2 | R3 |
|---|---|---|---|---|---|---|---|
| Standard | 2.81 | 3.08 | 3.23 | 3.50 | 3.65 | 3.92 | 4.07 |
| Camarilla | 3.27 | 3.30 | 3.34 | 3.38 | 3.42 | 3.46 | 3.50 |
| Woodie | 2.75 | 3.05 | 3.17 | 3.47 | 3.59 | 3.89 | 4.01 |
| Fibonacci | 3.08 | 3.24 | 3.34 | 3.50 | 3.66 | 3.76 | 3.92 |
| Pivot points | S3 | S2 | S1 | PP | R1 | R2 | R3 |
|---|---|---|---|---|---|---|---|
| Standard | 1.83 | 2.20 | 2.42 | 2.79 | 3.01 | 3.38 | 3.60 |
| Camarilla | 2.49 | 2.54 | 2.60 | 2.65 | 2.70 | 2.76 | 2.81 |
| Woodie | 1.77 | 2.16 | 2.36 | 2.75 | 2.95 | 3.34 | 3.54 |
| Fibonacci | 2.20 | 2.42 | 2.56 | 2.79 | 3.01 | 3.15 | 3.38 |
| Pivot points | S3 | S2 | S1 | PP | R1 | R2 | R3 |
|---|---|---|---|---|---|---|---|
| Standard | 2.54 | 3.32 | 3.76 | 4.54 | 4.98 | 5.76 | 6.20 |
| Camarilla | 3.88 | 3.99 | 4.10 | 4.21 | 4.32 | 4.43 | 4.55 |
| Woodie | 2.38 | 3.24 | 3.60 | 4.46 | 4.82 | 5.68 | 6.04 |
| Fibonacci | 3.32 | 3.78 | 4.07 | 4.54 | 5.00 | 5.29 | 5.76 |
Numerical data
The following is the status of the technical indicators and moving averages at the time of publication of this technical analysis:
| RSI (14): | 49.36 | |
| MACD (12,26,9): | -0.2500 | |
| Directional Movement: | 5.99 | |
| AROON (14): | 50.00 | |
| DEMA (21): | 2.91 | |
| Parabolic SAR (0,02-0,02-0,2): | 2.63 | |
| Elder Ray (13): | 0.41 | |
| Super Trend (3,10): | 2.53 | |
| Zig ZAG (10): | 3.38 | |
| VORTEX (21): | 0.8600 | |
| Stochastique (14,3,5): | 67.97 | |
| TEMA (21): | 2.90 | |
| Williams %R (14): | -34.37 | |
| Chande Momentum Oscillator (20): | 0.37 | |
| Repulse (5,40,3): | 0.9400 | |
| ROCnROLL: | -1 | |
| TRIX (15,9): | -1.3300 | |
| Courbe Coppock: | 24.89 |
| MA7: | 3.05 | |
| MA20: | 3.20 | |
| MA50: | 3.91 | |
| MA100: | 4.40 | |
| MAexp7: | 3.15 | |
| MAexp20: | 3.28 | |
| MAexp50: | 3.77 | |
| MAexp100: | 4.44 | |
| Price / MA7: | +10.82% | |
| Price / MA20: | +5.63% | |
| Price / MA50: | -13.55% | |
| Price / MA100: | -23.18% | |
| Price / MAexp7: | +7.30% | |
| Price / MAexp20: | +3.05% | |
| Price / MAexp50: | -10.34% | |
| Price / MAexp100: | -23.87% |
News
The last news published on LUCID GROUP INC. at the time of the generation of this analysis was as follows:
About author

Online


Add a comment
Comments
0 comments on the analysis LUCID GROUP INC. - Daily