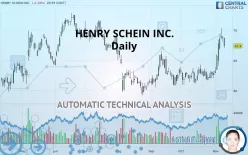
HENRY SCHEIN INC. - Daily - Technical analysis published on 11/12/2019 (GMT)
- 268
- 0
- Who voted?
Click here for a new analysis!
- Timeframe : Daily
- - Analysis generated on
- Status : TARGET REACHED

Summary of the analysis

Additional analysis
Quotes
HENRY SCHEIN INC. rating 67.40 USD. The price is lower by -2.19% since the last closing and was between 66.96 USD and 68.74 USD. This implies that the price is at +0.66% from its lowest and at -1.95% from its highest.The Central Gaps scanner detects a bearish opening. A small advantage for sellers in the very short term.
Bearish opening
Type : Bearish
Timeframe : Openning
Here is a more detailed summary of the historical variations registered by HENRY SCHEIN INC.:
Near a new HIGH record (1 month)
Type : Bullish
Timeframe : Weekly
Technical
Technical analysis of HENRY SCHEIN INC. in Daily shows an overall bullish trend. 71.43% of the signals given by moving averages are bullish. The overall trend is reinforced by the strong bullish signals from short-term moving averages. There is no crossing of moving average by the price or crossing of moving averages between themselves.
In fact, according to the parameters integrated into the Central Analyzer system, 13 technical indicators out of 18 analysed are currently bullish. Caution: the Central Indicators scanner currently detects an excess:
RSI indicator is overbought : over 70
Type : Neutral
Timeframe : Daily
CCI indicator is overbought : over 100
Type : Neutral
Timeframe : Daily
Williams %R indicator is overbought : over -20
Type : Neutral
Timeframe : Daily
Pivot points : price is under support 3
Type : Neutral
Timeframe : Daily
Price is back over the pivot point
Type : Bullish
Timeframe : Weekly
An analysis of the price chart with the Central Patterns scanner (detector of chart patterns and resistances and supports) shows several results that can have an impact on the price change:
Near horizontal resistance
Type : Bearish
Timeframe : Daily
Near resistance of triangle
Type : Bearish
Timeframe : Daily
Resistance of channel is broken
Type : Bullish
Timeframe : Daily
From the Japanese candlestick perspective, the Central Candlesticks scanner notes the presence of these results that could impact the short-term trend:
White hanging man / hammer
Type : Neutral
Timeframe : Daily
Bullish harami
Type : Bullish
Timeframe : Daily
| S3 | S2 | S1 | Price | R1 | R2 | R3 | |
|---|---|---|---|---|---|---|---|
| ProTrendLines | 57.40 | 63.84 | 65.84 | 67.40 | 68.88 | 71.97 | 79.45 |
| Change (%) | -14.84% | -5.28% | -2.31% | - | +2.20% | +6.78% | +17.88% |
| Change | -10.00 | -3.56 | -1.56 | - | +1.48 | +4.57 | +12.05 |
| Level | Major | Major | Minor | - | Major | Major | Intermediate |
Pivot points can also be used to set your price objectives. Here is the price situation in relation to pivot points:
| Pivot points | S3 | S2 | S1 | PP | R1 | R2 | R3 |
|---|---|---|---|---|---|---|---|
| Standard | 67.54 | 67.82 | 68.36 | 68.64 | 69.18 | 69.46 | 70.00 |
| Camarilla | 68.68 | 68.76 | 68.84 | 68.91 | 68.99 | 69.06 | 69.14 |
| Woodie | 67.68 | 67.89 | 68.50 | 68.71 | 69.32 | 69.53 | 70.14 |
| Fibonacci | 67.82 | 68.13 | 68.32 | 68.64 | 68.95 | 69.14 | 69.46 |
| Pivot points | S3 | S2 | S1 | PP | R1 | R2 | R3 |
|---|---|---|---|---|---|---|---|
| Standard | 57.87 | 60.65 | 64.78 | 67.56 | 71.69 | 74.47 | 78.60 |
| Camarilla | 67.01 | 67.64 | 68.28 | 68.91 | 69.54 | 70.18 | 70.81 |
| Woodie | 58.55 | 60.99 | 65.46 | 67.90 | 72.37 | 74.81 | 79.28 |
| Fibonacci | 60.65 | 63.29 | 64.92 | 67.56 | 70.20 | 71.83 | 74.47 |
| Pivot points | S3 | S2 | S1 | PP | R1 | R2 | R3 |
|---|---|---|---|---|---|---|---|
| Standard | 57.60 | 59.27 | 60.93 | 62.59 | 64.25 | 65.92 | 67.58 |
| Camarilla | 61.67 | 61.98 | 62.28 | 62.59 | 62.89 | 63.20 | 63.50 |
| Woodie | 57.60 | 59.27 | 60.92 | 62.59 | 64.25 | 65.92 | 67.57 |
| Fibonacci | 59.27 | 60.54 | 61.32 | 62.59 | 63.86 | 64.65 | 65.92 |
Numerical data
The following is the status of the technical indicators and moving averages at the time of publication of this technical analysis:
| RSI (14): | 63.72 | |
| MACD (12,26,9): | 1.4500 | |
| Directional Movement: | 17.14 | |
| AROON (14): | 64.28 | |
| DEMA (21): | 66.63 | |
| Parabolic SAR (0,02-0,02-0,2): | 64.27 | |
| Elder Ray (13): | 1.97 | |
| Super Trend (3,10): | 64.38 | |
| Zig ZAG (10): | 67.40 | |
| VORTEX (21): | 1.1000 | |
| Stochastique (14,3,5): | 76.90 | |
| TEMA (21): | 67.89 | |
| Williams %R (14): | -34.13 | |
| Chande Momentum Oscillator (20): | 5.46 | |
| Repulse (5,40,3): | 0.4000 | |
| ROCnROLL: | 1 | |
| TRIX (15,9): | 0.1800 | |
| Courbe Coppock: | 14.33 |
| MA7: | 67.20 | |
| MA20: | 64.23 | |
| MA50: | 63.31 | |
| MA100: | 64.60 | |
| MAexp7: | 67.11 | |
| MAexp20: | 65.04 | |
| MAexp50: | 64.01 | |
| MAexp100: | 64.49 | |
| Price / MA7: | +0.30% | |
| Price / MA20: | +4.94% | |
| Price / MA50: | +6.46% | |
| Price / MA100: | +4.33% | |
| Price / MAexp7: | +0.43% | |
| Price / MAexp20: | +3.63% | |
| Price / MAexp50: | +5.30% | |
| Price / MAexp100: | +4.51% |
News
The last news published on HENRY SCHEIN INC. at the time of the generation of this analysis was as follows:
- Henry Schein To Expand Its Medical Group With Acquisition Of North American Rescue
- Henry Schein Ranks First In Its Industry On List Of FORTUNE's 'World's Most Admired Companies'
-
 Lots of opportunity in telemedicine: Henry Schein CEO
- Henry Schein Announces New Distribution Date And Anticipated When-Issued Trading Market For Spin-Off Of Animal Health Business
- Henry Schein Announces Record Date, Distribution Date And Anticipated When-Issued Trading Market For Spin-Off Of Animal Health Business
About author

Online


Add a comment
Comments
0 comments on the analysis HENRY SCHEIN INC. - Daily