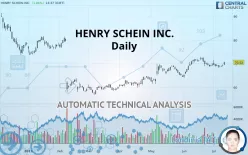
HENRY SCHEIN INC. - Daily - Technical analysis published on 07/11/2019 (GMT)
- 255
- 0
- Who voted?
Click here for a new analysis!
- Timeframe : Daily
- - Analysis generated on
- Status : INVALID

Summary of the analysis

Additional analysis
Quotes
The HENRY SCHEIN INC. rating is 70.52 USD. The price has increased by +1.86% since the last closing and was between 69.30 USD and 70.75 USD. This implies that the price is at +1.76% from its lowest and at -0.33% from its highest.The Central Gaps scanner detects a bullish opening. A small advantage for buyers in the very short term.
Bullish opening
Type : Bullish
Timeframe : Openning
Here is a more detailed summary of the historical variations registered by HENRY SCHEIN INC.:
Technical
Technical analysis of HENRY SCHEIN INC. in Daily shows a strongly overall bullish trend. 85.71% of the signals given by moving averages are bullish. The slightly bullish signals given by the short-term moving averages indicate this trend is showing signs of running out of steam. The Central Indicators market scanner currently does not detect any result that concerns moving averages.
The technical indicators are generally neutral. They do not provide relevant information on the direction of future price movements.
Caution: the Central Indicators scanner currently detects an excess:
Williams %R indicator is oversold : under -80
Type : Neutral
Timeframe : Daily
Pivot points : price is over resistance 1
Type : Neutral
Timeframe : Daily
RSI indicator is back over 50
Type : Bullish
Timeframe : Daily
Price is back under the pivot point
Type : Bearish
Timeframe : Weekly
An analysis of the price chart with the Central Patterns scanner (detector of chart patterns and resistances and supports) shows several results that can have an impact on the price change:
Near horizontal resistance
Type : Bearish
Timeframe : Daily
Near support of channel
Type : Bullish
Timeframe : Daily
No result was found by the Central Candlesticks scanner on Japanese candlesticks.
| S3 | S2 | S1 | Price | R1 | R2 | R3 | |
|---|---|---|---|---|---|---|---|
| ProTrendLines | 63.71 | 66.50 | 69.25 | 70.52 | 73.52 | 79.45 | 90.40 |
| Change (%) | -9.66% | -5.70% | -1.80% | - | +4.25% | +12.66% | +28.19% |
| Change | -6.81 | -4.02 | -1.27 | - | +3.00 | +8.93 | +19.88 |
| Level | Major | Intermediate | Intermediate | - | Major | Intermediate | Intermediate |
Pivot points can also be used to set your price objectives. Here is the price situation in relation to pivot points:
| Pivot points | S3 | S2 | S1 | PP | R1 | R2 | R3 |
|---|---|---|---|---|---|---|---|
| Standard | 68.05 | 68.33 | 68.62 | 68.90 | 69.18 | 69.46 | 69.75 |
| Camarilla | 68.75 | 68.80 | 68.85 | 68.90 | 68.95 | 69.00 | 69.06 |
| Woodie | 68.05 | 68.33 | 68.62 | 68.90 | 69.18 | 69.46 | 69.75 |
| Fibonacci | 68.33 | 68.55 | 68.68 | 68.90 | 69.11 | 69.24 | 69.46 |
| Pivot points | S3 | S2 | S1 | PP | R1 | R2 | R3 |
|---|---|---|---|---|---|---|---|
| Standard | 64.22 | 66.15 | 67.65 | 69.58 | 71.08 | 73.01 | 74.51 |
| Camarilla | 68.22 | 68.53 | 68.85 | 69.16 | 69.47 | 69.79 | 70.10 |
| Woodie | 64.02 | 66.04 | 67.45 | 69.47 | 70.88 | 72.90 | 74.31 |
| Fibonacci | 66.15 | 67.46 | 68.27 | 69.58 | 70.89 | 71.70 | 73.01 |
Numerical data
The following are the details of the technical indicators and moving averages that were collected to generate this technical analysis:
| RSI (14): | 51.18 | |
| MACD (12,26,9): | 0.2100 | |
| Directional Movement: | 3.07 | |
| AROON (14): | -78.57 | |
| DEMA (21): | 69.80 | |
| Parabolic SAR (0,02-0,02-0,2): | 71.08 | |
| Elder Ray (13): | -0.18 | |
| Super Trend (3,10): | 68.31 | |
| Zig ZAG (10): | 69.23 | |
| VORTEX (21): | 0.9700 | |
| Stochastique (14,3,5): | 20.97 | |
| TEMA (21): | 69.12 | |
| Williams %R (14): | -73.93 | |
| Chande Momentum Oscillator (20): | -0.65 | |
| Repulse (5,40,3): | 0.3700 | |
| ROCnROLL: | -1 | |
| TRIX (15,9): | 0.1100 | |
| Courbe Coppock: | 5.10 |
| MA7: | 69.22 | |
| MA20: | 70.08 | |
| MA50: | 68.16 | |
| MA100: | 64.38 | |
| MAexp7: | 69.41 | |
| MAexp20: | 69.31 | |
| MAexp50: | 68.16 | |
| MAexp100: | 68.15 | |
| Price / MA7: | +1.88% | |
| Price / MA20: | +0.63% | |
| Price / MA50: | +3.46% | |
| Price / MA100: | +9.54% | |
| Price / MAexp7: | +1.60% | |
| Price / MAexp20: | +1.75% | |
| Price / MAexp50: | +3.46% | |
| Price / MAexp100: | +3.48% |
News
The last news published on HENRY SCHEIN INC. at the time of the generation of this analysis was as follows:
- Henry Schein To Expand Its Medical Group With Acquisition Of North American Rescue
- Henry Schein Ranks First In Its Industry On List Of FORTUNE's 'World's Most Admired Companies'
-
 Lots of opportunity in telemedicine: Henry Schein CEO
- Henry Schein Announces New Distribution Date And Anticipated When-Issued Trading Market For Spin-Off Of Animal Health Business
- Henry Schein Announces Record Date, Distribution Date And Anticipated When-Issued Trading Market For Spin-Off Of Animal Health Business
About author

Online


Add a comment
Comments
0 comments on the analysis HENRY SCHEIN INC. - Daily