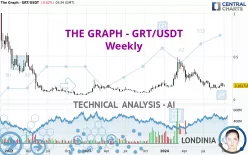
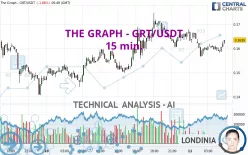
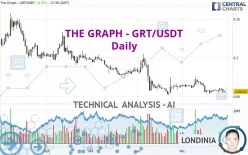
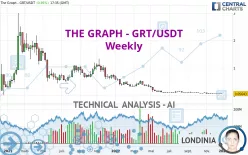
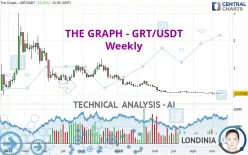
THE GRAPH - GRT/USDT Technical Analyses
THE GRAPH - GRT/USDT - More technical analyses...
- 0
- 93888
- 15802
- 0
Status : INVALID
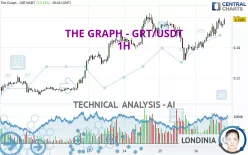
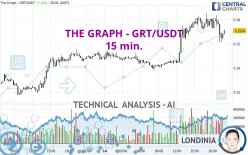
Simple chart
- 154
- 0
- 0
- 5
- 118
- 86
- 5
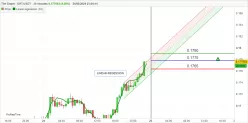
Chart + Trading signal
- 174
- 0
- 0
- 0
- 93888
- 15802
- 0

Status : INVALID
Simple chart
- 541
- 0
- 0
- 0
- 93888
- 15802
- 0
Status : INVALID
Simple chart
- 234
- 0
- 0
- 0
- 93888
- 15802
- 0
Status : LEVEL MAINTAINED
Simple chart
- 238
- 0
- 0
- 0
- 93888
- 15802
- 0
Status : NEUTRAL
Simple chart
- 433
- 0
- 0
- 0
- 93888
- 15802
- 0
Status : INVALID
Simple chart
- 255
- 0
- 0
- 0
- 93888
- 15802
- 0
Status : INVALID
Simple chart
- 212
- 0
- 0
- 0
- 93888
- 15802
- 0
Status : LEVEL MAINTAINED
Simple chart
- 204
- 0
- 0
- 0
- 93888
- 15802
- 0
Status : INVALID
Simple chart
- 155
- 0
- 0
- 0
- 93888
- 15802
- 0
Status : INVALID
Simple chart
- 142
- 0
- 0
- 0
- 93888
- 15802
- 0
Status : INVALID
Simple chart
- 185
- 0
- 0

