THE GRAPH - GRT/USDT overview
THE GRAPH - GRT/USDT
> Analyses
 Thank you
Reply
Chart
Thank you
Reply
Chart
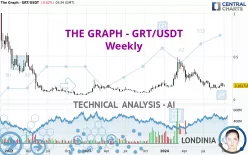
Timeframe : Weekly - Simple chart
Status : INVALID
All elements being clearly bearish, it would be possible for traders to trade only short positions (for sale) on THE GRAPH - GRT/USDT as long as the price remains well below 0.208300 USDT. The…
THE GRAPH - GRT/USDT
> Analyses

 Thank you
Reply
Chart
Thank you
Reply
Chart
tariyia has published a new analysis.
- 5
- 118
- 86
- 5
Timeframe : 30 min. - Chart + Trading signal
GRT/USDT @ (Timeframe 30 Minutes)
Bullish LINEAR REGRESSION (TF M30)
Williams Fractal Trailing Stops Bullish (TF 2H)
EMA (10) Bullish (TF 1H)
At Higher Timeframe
Momentum (10) Bullish (TF…
THE GRAPH - GRT/USDT
> Analyses
 Thank you
Reply
Chart
Thank you
Reply
Chart
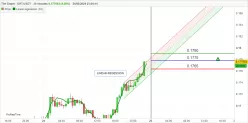
Timeframe : Daily - Simple chart
Status : INVALID
The bullish trend is currently very strong on THE GRAPH - GRT/USDT. As long as the price remains above the support at 0.198342 USDT, you could try to benefit from the boom. The first bullish objective…
THE GRAPH - GRT/USDT
> Analyses
 Thank you
Reply
Chart
Thank you
Reply
Chart
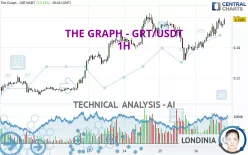
Timeframe : 1H - Simple chart
Status : INVALID
The bullish trend is currently very strong on THE GRAPH - GRT/USDT. As long as the price remains above the support at 0.158250 USDT, you could try to benefit from the boom. The first bullish objective…
THE GRAPH - GRT/USDT
> Analyses
 Thank you
Reply
Chart
Thank you
Reply
Chart
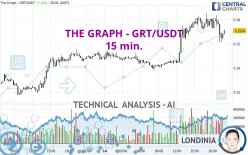
Timeframe : 15 min. - Simple chart
Status : LEVEL MAINTAINED
Has the basic bullish trend slowed or is it lacking in power? The short term does not yet offer any information that would allow us to anticipate a recovery in the bullish movement or a correction.…
THE GRAPH - GRT/USDT
> Analyses

 Thank you
Reply
Chart
Thank you
Reply
Chart
Londinia
has published a new analysis for Consciousconnection.
- 0
- 94229
- 15812
- 0
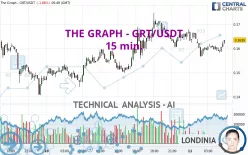
Timeframe : 15 min. - Simple chart
Status : NEUTRAL
The short-term and basic trend is neutral. In this situation, the price of THE GRAPH - GRT/USDT could just as easily move towards the first resistance as the first support. No statistical advantage is…
THE GRAPH - GRT/USDT
> Analyses
 Thank you
Reply
Chart
Thank you
Reply
Chart
Londinia
has published a new analysis for Consciousconnection.
- 0
- 94229
- 15812
- 0
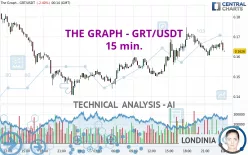
Timeframe : 15 min. - Simple chart
Status : INVALID
Has the basic bullish trend slowed or is it lacking in power? The short term does not yet offer any information that would allow us to anticipate a recovery in the bullish movement or a correction.…
THE GRAPH - GRT/USDT
> Analyses
 Thank you
Reply
Chart
Thank you
Reply
Chart
Londinia
has published a new analysis for Consciousconnection.
- 0
- 94229
- 15812
- 0
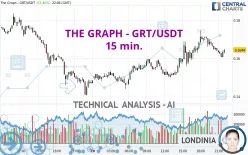
Timeframe : 15 min. - Simple chart
Status : INVALID
Has the basic bullish trend slowed or is it lacking in power? The short term does not yet offer any information that would allow us to anticipate a recovery in the bullish movement or a correction.…

