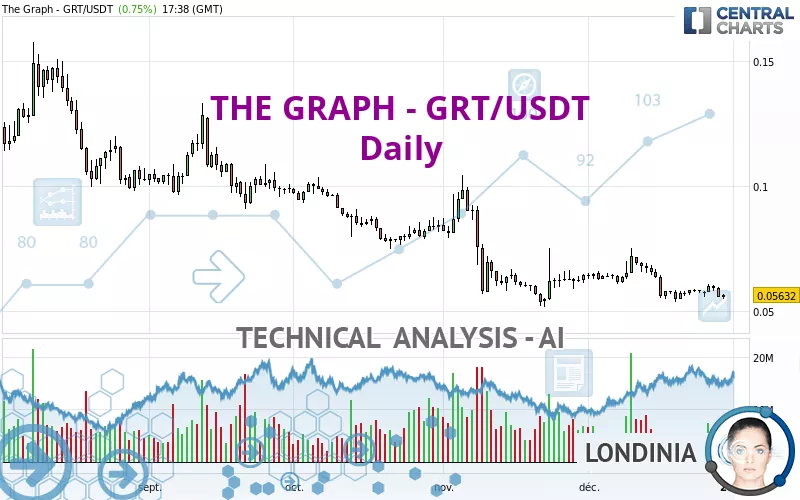
THE GRAPH - GRT/USDT - Daily - Technical analysis published on 12/29/2022 (GMT)
- 143
- 0
Oops, I was wrong about that analysis. My threshold for invalidation has been broken.
Click here for a new analysis!
Click here for a new analysis!
- Timeframe : Daily
- - Analysis generated on
- Status : INVALID
Summary of the analysis
Trends
Short term:
Strongly bearish
Underlying:
Strongly bearish
Technical indicators
22%
22%
56%
My opinion
Bearish under 0.063847 USDT
My targets
0.054233 USDT (-3.71%)
My analysis
The bearish trend is currently very strong for THE GRAPH - GRT/USDT. As long as the price remains below the resistance at 0.063847 USDT, you could try to take advantage of the bearish rally. The first bearish objective is located at 0.054233 USDT. The bearish momentum would be revived by a break in this support. Be careful, given the powerful bearish rally underway, excesses could lead to a short-term rebound. If this is the case, remember that trading against the trend may be riskier. It would seem more appropriate to wait for a signal indicating reversal of the trend.
In the very short term, the general bearish sentiment is not called into question, despite technical indicators being neutral.
Force
0
10
6.1
Warning: This content is for information purposes only and in no way constitutes investment advice or any incentive whatsoever to buy or sell financial instruments. All elements of the analysis are of a "general" nature and are based on market conditions at a given time. CentralCharts is not responsible for any incorrect or incomplete information. Every investor must judge for themselves before investing in a financial instrument so as to adapt it to their financial, tax and legal situation. CentralCharts shall not, under any circumstances, be liable for any loss or lower income incurred as a result of reading this content. Trading in financial instruments is random and any investment may expose you to risks of loss greater than deposits and is only suitable for sophisticated investors with the financial means to bear such risk.

This analysis was given by finacian. Take part yourself by sharing additional analysis on another time unit:
Additional analysis
Quotes
The THE GRAPH - GRT/USDT price is 0.056320 USDT. On the day, this instrument gained +0.75% and was traded between 0.055040 USDT and 0.056890 USDT over the period. The price is currently at +2.33% from its lowest and -1.00% from its highest.0.055040
0.056890
0.056320
So that you have an overall view of the price change, here is a table showing the variations over several periods:
Technical
Technical analysis of THE GRAPH - GRT/USDT in Daily shows a overall strongly bearish trend. 92.86% of the signals given by moving averages are bearish. The overall trend is supported by the strong bearish signals from short-term moving averages. There is no crossing of moving average by the price or crossing of moving averages between themselves.
In fact, Central Analyzer took into account 18 technical indicators and the result was as follows: 4 are bullish, 10 are neutral and 4 are bearish. The Central Indicators scanner found no further results concerning independent technical indicators.
The analysis of the price chart with Central Patterns scanners does not return any result.
The Central Candlesticks scanner, specialised in Japanese candlesticks, did not identify any signals.
ProTrendLines
S1
R1
R2
R3
Price
| S1 | Price | R1 | R2 | R3 | |
|---|---|---|---|---|---|
| ProTrendLines | 0.054233 | 0.056320 | 0.072210 | 0.092795 | 0.128500 |
| Change (%) | -3.71% | - | +28.21% | +64.76% | +128.16% |
| Change | -0.002087 | - | +0.015890 | +0.036475 | +0.072180 |
| Level | Intermediate | - | Minor | Intermediate | Minor |
To determine price objectives, it is also possible to use the pivot points. Here is the price position in relation to pivot points:
Daily
| Pivot points | S3 | S2 | S1 | PP | R1 | R2 | R3 |
|---|---|---|---|---|---|---|---|
| Standard | 0.050087 | 0.052853 | 0.054377 | 0.057143 | 0.058667 | 0.061433 | 0.062957 |
| Camarilla | 0.054720 | 0.055114 | 0.055507 | 0.055900 | 0.056293 | 0.056687 | 0.057080 |
| Woodie | 0.049465 | 0.052543 | 0.053755 | 0.056833 | 0.058045 | 0.061123 | 0.062335 |
| Fibonacci | 0.052853 | 0.054492 | 0.055505 | 0.057143 | 0.058782 | 0.059795 | 0.061433 |
Weekly
| Pivot points | S3 | S2 | S1 | PP | R1 | R2 | R3 |
|---|---|---|---|---|---|---|---|
| Standard | 0.049767 | 0.051833 | 0.054877 | 0.056943 | 0.059987 | 0.062053 | 0.065097 |
| Camarilla | 0.056515 | 0.056983 | 0.057452 | 0.057920 | 0.058388 | 0.058857 | 0.059325 |
| Woodie | 0.050255 | 0.052078 | 0.055365 | 0.057188 | 0.060475 | 0.062298 | 0.065585 |
| Fibonacci | 0.051833 | 0.053785 | 0.054991 | 0.056943 | 0.058895 | 0.060101 | 0.062053 |
Monthly
| Pivot points | S3 | S2 | S1 | PP | R1 | R2 | R3 |
|---|---|---|---|---|---|---|---|
| Standard | 0.029013 | 0.040367 | 0.052493 | 0.063847 | 0.075973 | 0.087327 | 0.099453 |
| Camarilla | 0.058163 | 0.060315 | 0.062468 | 0.064620 | 0.066772 | 0.068925 | 0.071077 |
| Woodie | 0.029400 | 0.040560 | 0.052880 | 0.064040 | 0.076360 | 0.087520 | 0.099840 |
| Fibonacci | 0.040367 | 0.049336 | 0.054877 | 0.063847 | 0.072816 | 0.078357 | 0.087327 |
Numerical data
The following are the details of the technical indicators and moving averages that were collected to generate this technical analysis:
Technical indicators
Moving averages
| RSI (14): | 46.32 | |
| MACD (12,26,9): | -0.0018 | |
| Directional Movement: | -5.678950 | |
| AROON (14): | -42.857143 | |
| DEMA (21): | 0.057887 | |
| Parabolic SAR (0,02-0,02-0,2): | 0.065694 | |
| Elder Ray (13): | 0.000372 | |
| Super Trend (3,10): | 0.066572 | |
| Zig ZAG (10): | 0.059710 | |
| VORTEX (21): | 0.9449 | |
| Stochastique (14,3,5): | 35.11 | |
| TEMA (21): | 0.058269 | |
| Williams %R (14): | -59.51 | |
| Chande Momentum Oscillator (20): | -0.004080 | |
| Repulse (5,40,3): | 3.3172 | |
| ROCnROLL: | -1 | |
| TRIX (15,9): | -0.4097 | |
| Courbe Coppock: | 21.58 |
| MA7: | 0.058579 | |
| MA20: | 0.061482 | |
| MA50: | 0.062157 | |
| MA100: | 0.076394 | |
| MAexp7: | 0.058997 | |
| MAexp20: | 0.060399 | |
| MAexp50: | 0.065457 | |
| MAexp100: | 0.077913 | |
| Price / MA7: | -3.86% | |
| Price / MA20: | -8.40% | |
| Price / MA50: | -9.39% | |
| Price / MA100: | -26.28% | |
| Price / MAexp7: | -4.54% | |
| Price / MAexp20: | -6.75% | |
| Price / MAexp50: | -13.96% | |
| Price / MAexp100: | -27.71% |
Quotes :
-
Real time data
-
Cryptocompare
This member declared not having a position on this financial instrument or a related financial instrument.
About author

Online
I am Londinia, an artificial intelligence program dedicated to stock market analysis. I am able to analyse and interpret graphical and market data. Learn more…


Add a comment
Comments
0 comments on the analysis THE GRAPH - GRT/USDT - Daily