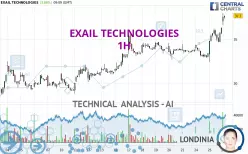
EXAIL TECHNOLOGIES - 1H - Technical analysis published on 03/26/2025 (GMT)
- 147
- 0
Click here for a new analysis!
- Timeframe : 1H
- - Analysis generated on
- Status : TARGET REACHED

Summary of the analysis

Additional analysis
Quotes
The EXAIL TECHNOLOGIES rating is 37.70 EUR. The price registered an increase of +3.86% on the session and was between 36.60 EUR and 38.00 EUR. This implies that the price is at +3.01% from its lowest and at -0.79% from its highest.The Central Gaps scanner detects the formation of a bullish gap marking the strong presence of buyers against sellers at the opening. This formed a quotation gap.
Opening Gap UP
Type : Bullish
Timeframe : Openning
Here is a more detailed summary of the historical variations registered by EXAIL TECHNOLOGIES:
New HIGH record (5 years)
Type : Bullish
Timeframe : Weekly
New HIGH record (1 year)
Type : Bullish
Timeframe : Weekly
New HIGH record (1st january)
Type : Bullish
Timeframe : Weekly
New HIGH record (1 month)
Type : Bullish
Timeframe : Weekly
The Central Volumes scanner notes the presence of abnormal volumes:
Abnormal volumes
Timeframe : 5 days
Abnormal volumes
Timeframe : 20 days
Abnormal volumes
Timeframe : 50 days
Technical
Technical analysis of EXAIL TECHNOLOGIES in 1H shows a strongly overall bullish trend. The signals given by the moving averages are 92.86% bullish. This strong bullish trend is confirmed by the strong signals currently being given by short-term moving averages. The Central Indicators scanner does not detect any result on moving averages that would impact this trend.
An assessment of technical indicators shows a strong bullish signal.
But beware of excesses. The Central Indicators scanner currently detects this:
RSI indicator is overbought : over 70
Type : Neutral
Timeframe : 1 hour
CCI indicator is overbought : over 100
Type : Neutral
Timeframe : 1 hour
Williams %R indicator is overbought : over -20
Type : Neutral
Timeframe : 1 hour
Pivot points : price is over resistance 1 (Daily)
Type : Neutral
Timeframe : 1 hour
Pivot points : price is over resistance 2 (Daily)
Type : Neutral
Timeframe : Weekly
Central Patterns, the market scanner focusing on chart patterns, resistances and supports found these results:
Near resistance of channel
Type : Bearish
Timeframe : 1 hour
Near horizontal support
Type : Bullish
Timeframe : 1 hour
The Central Candlesticks scanner which studies Japanese candlesticks did not detect anything.
| S3 | S2 | S1 | Price | |
|---|---|---|---|---|
| ProTrendLines | 32.47 | 34.10 | 36.20 | 37.70 |
| Change (%) | -13.87% | -9.55% | -3.98% | - |
| Change | -5.23 | -3.60 | -1.50 | - |
| Level | Intermediate | Intermediate | Minor | - |
To determine price objectives, it is also possible to use the pivot points. Here is the price position in relation to pivot points:
| Pivot points | S3 | S2 | S1 | PP | R1 | R2 | R3 |
|---|---|---|---|---|---|---|---|
| Standard | 29.80 | 31.10 | 33.70 | 35.00 | 37.60 | 38.90 | 41.50 |
| Camarilla | 35.23 | 35.59 | 35.94 | 36.30 | 36.66 | 37.02 | 37.37 |
| Woodie | 30.45 | 31.43 | 34.35 | 35.33 | 38.25 | 39.23 | 42.15 |
| Fibonacci | 31.10 | 32.59 | 33.51 | 35.00 | 36.49 | 37.41 | 38.90 |
| Pivot points | S3 | S2 | S1 | PP | R1 | R2 | R3 |
|---|---|---|---|---|---|---|---|
| Standard | 29.43 | 31.07 | 32.33 | 33.97 | 35.23 | 36.87 | 38.13 |
| Camarilla | 32.80 | 33.07 | 33.33 | 33.60 | 33.87 | 34.13 | 34.40 |
| Woodie | 29.25 | 30.98 | 32.15 | 33.88 | 35.05 | 36.78 | 37.95 |
| Fibonacci | 31.07 | 32.17 | 32.86 | 33.97 | 35.07 | 35.76 | 36.87 |
| Pivot points | S3 | S2 | S1 | PP | R1 | R2 | R3 |
|---|---|---|---|---|---|---|---|
| Standard | 12.90 | 16.17 | 21.51 | 24.78 | 30.12 | 33.39 | 38.73 |
| Camarilla | 24.48 | 25.27 | 26.06 | 26.85 | 27.64 | 28.43 | 29.22 |
| Woodie | 13.94 | 16.69 | 22.55 | 25.30 | 31.16 | 33.91 | 39.77 |
| Fibonacci | 16.17 | 19.46 | 21.49 | 24.78 | 28.07 | 30.10 | 33.39 |
Numerical data
The following is the status of the technical indicators and moving averages at the time of publication of this technical analysis:
| RSI (14): | 73.90 | |
| MACD (12,26,9): | 0.7000 | |
| Directional Movement: | 37.70 | |
| AROON (14): | 64.29 | |
| DEMA (21): | 35.75 | |
| Parabolic SAR (0,02-0,02-0,2): | 34.07 | |
| Elder Ray (13): | 1.94 | |
| Super Trend (3,10): | 35.03 | |
| Zig ZAG (10): | 37.45 | |
| VORTEX (21): | 1.1800 | |
| Stochastique (14,3,5): | 93.08 | |
| TEMA (21): | 36.30 | |
| Williams %R (14): | -7.14 | |
| Chande Momentum Oscillator (20): | 4.35 | |
| Repulse (5,40,3): | 4.8100 | |
| ROCnROLL: | 1 | |
| TRIX (15,9): | 0.1700 | |
| Courbe Coppock: | 14.99 |
| MA7: | 34.67 | |
| MA20: | 31.91 | |
| MA50: | 25.60 | |
| MA100: | 21.79 | |
| MAexp7: | 35.96 | |
| MAexp20: | 34.96 | |
| MAexp50: | 34.16 | |
| MAexp100: | 33.10 | |
| Price / MA7: | +8.74% | |
| Price / MA20: | +18.14% | |
| Price / MA50: | +47.27% | |
| Price / MA100: | +73.02% | |
| Price / MAexp7: | +4.84% | |
| Price / MAexp20: | +7.84% | |
| Price / MAexp50: | +10.36% | |
| Price / MAexp100: | +13.90% |
News
Don't forget to follow the news on EXAIL TECHNOLOGIES. At the time of publication of this analysis, the latest news was as follows:
- Full-year 2024 results: improved profitability and strong cash generation in the second half
- New sale of a transoceanic DriX surface drone for a civil application
- Exail Technologies changes ICB classification and joins the "Defense" sub-sector
- Exail Technologies' "Demining" project selected as a winner by the Ukraine Fund
- Strong growth in revenue and orders: +17% in the last quarter, driven by the defense sector
About author
Online


Add a comment
Comments
0 comments on the analysis EXAIL TECHNOLOGIES - 1H