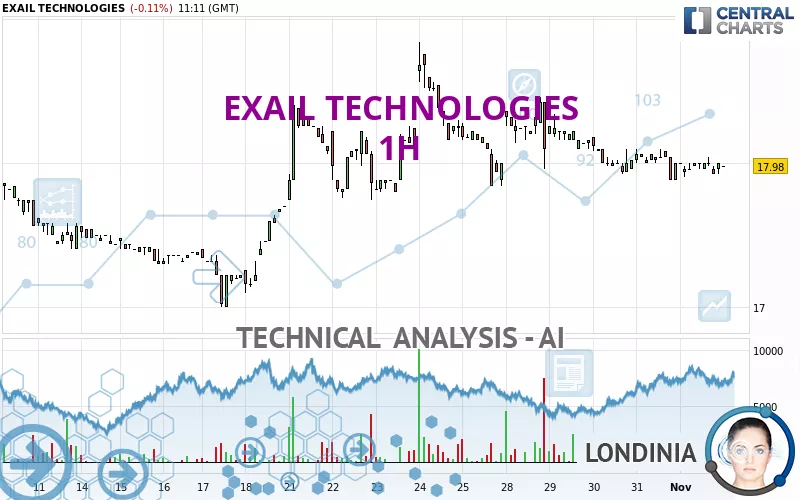
EXAIL TECHNOLOGIES - 1H - Technical analysis published on 11/04/2024 (GMT)
- 96
- 0
Click here for a new analysis!
- Timeframe : 1H
- - Analysis generated on
- Status : INVALID
Summary of the analysis

Additional analysis
Quotes
The EXAIL TECHNOLOGIES price is 17.98 EUR. The price registered a decrease of -0.11% on the session and was traded between 17.92 EUR and 18.04 EUR over the period. The price is currently at +0.33% from its lowest and -0.33% from its highest.A study of price movements over other periods shows the following variations:
Near a new HIGH record (1 month)
Type : Bullish
Timeframe : Weekly
Technical
Technical analysis of EXAIL TECHNOLOGIES in 1H shows an overall bearish trend. The signals given by moving averages are 71.43% bearish. This bearish trend is reinforced by the strong signals currently being given by short-term moving averages. The Central Indicators scanner detects bearish signals on moving averages that could impact this trend:
Bearish price crossover with Moving Average 20
Type : Bearish
Timeframe : 1 hour
Bearish price crossover with adaptative moving average 100
Type : Bearish
Timeframe : 1 hour
In fact, of the 18 technical indicators analysed by Central Analyzer, 6 are bullish, 6 are neutral and 6 are bearish. Central Indicators, the detector scanner for these technical indicators has recently detected several signals:
Price is back over the pivot point
Type : Bullish
Timeframe : 1 hour
Williams %R indicator is back under -50
Type : Bearish
Timeframe : 1 hour
The Central Patterns scanner, which studies chart patterns, resistances and supports, has identified these signals:
Near horizontal support
Type : Bullish
Timeframe : 1 hour
Near support of channel
Type : Bullish
Timeframe : 1 hour
Central Candlesticks, the scanner specialised in Japanese candlesticks, detects these signals that could have an impact on the current short-term trend:
Doji
Type : Neutral
Timeframe : 1 hour
Bearish harami cross
Type : Bearish
Timeframe : 1 hour
| S3 | S2 | S1 | Price | R1 | R2 | R3 | |
|---|---|---|---|---|---|---|---|
| ProTrendLines | 16.75 | 17.00 | 17.40 | 17.98 | 18.09 | 18.46 | 18.84 |
| Change (%) | -6.84% | -5.45% | -3.23% | - | +0.61% | +2.67% | +4.78% |
| Change | -1.23 | -0.98 | -0.58 | - | +0.11 | +0.48 | +0.86 |
| Level | Major | Minor | Intermediate | - | Major | Intermediate | Minor |
Attention could also be paid to pivot points to set price objectives:
| Pivot points | S3 | S2 | S1 | PP | R1 | R2 | R3 |
|---|---|---|---|---|---|---|---|
| Standard | 17.83 | 17.87 | 17.93 | 17.97 | 18.03 | 18.07 | 18.13 |
| Camarilla | 17.97 | 17.98 | 17.99 | 18.00 | 18.01 | 18.02 | 18.03 |
| Woodie | 17.85 | 17.88 | 17.95 | 17.98 | 18.05 | 18.08 | 18.15 |
| Fibonacci | 17.87 | 17.91 | 17.93 | 17.97 | 18.01 | 18.03 | 18.07 |
| Pivot points | S3 | S2 | S1 | PP | R1 | R2 | R3 |
|---|---|---|---|---|---|---|---|
| Standard | 17.19 | 17.53 | 17.77 | 18.11 | 18.35 | 18.69 | 18.93 |
| Camarilla | 17.84 | 17.89 | 17.95 | 18.00 | 18.05 | 18.11 | 18.16 |
| Woodie | 17.13 | 17.51 | 17.71 | 18.09 | 18.29 | 18.67 | 18.87 |
| Fibonacci | 17.53 | 17.76 | 17.89 | 18.11 | 18.34 | 18.47 | 18.69 |
| Pivot points | S3 | S2 | S1 | PP | R1 | R2 | R3 |
|---|---|---|---|---|---|---|---|
| Standard | 15.21 | 16.11 | 17.05 | 17.95 | 18.89 | 19.79 | 20.73 |
| Camarilla | 17.49 | 17.66 | 17.83 | 18.00 | 18.17 | 18.34 | 18.51 |
| Woodie | 15.24 | 16.12 | 17.08 | 17.96 | 18.92 | 19.80 | 20.76 |
| Fibonacci | 16.11 | 16.81 | 17.24 | 17.95 | 18.65 | 19.08 | 19.79 |
Numerical data
The following is the status of technical indicators and moving averages registered at the time this technical analysis was created:
| RSI (14): | 46.38 | |
| MACD (12,26,9): | -0.0300 | |
| Directional Movement: | -12.78 | |
| AROON (14): | -14.29 | |
| DEMA (21): | 17.96 | |
| Parabolic SAR (0,02-0,02-0,2): | 17.89 | |
| Elder Ray (13): | -0.01 | |
| Super Trend (3,10): | 18.15 | |
| Zig ZAG (10): | 17.98 | |
| VORTEX (21): | 1.0000 | |
| Stochastique (14,3,5): | 39.39 | |
| TEMA (21): | 17.96 | |
| Williams %R (14): | -54.55 | |
| Chande Momentum Oscillator (20): | -0.06 | |
| Repulse (5,40,3): | 0.2000 | |
| ROCnROLL: | 2 | |
| TRIX (15,9): | -0.0300 | |
| Courbe Coppock: | 0.35 |
| MA7: | 18.04 | |
| MA20: | 17.82 | |
| MA50: | 17.74 | |
| MA100: | 17.70 | |
| MAexp7: | 17.98 | |
| MAexp20: | 18.00 | |
| MAexp50: | 18.04 | |
| MAexp100: | 18.00 | |
| Price / MA7: | -0.33% | |
| Price / MA20: | +0.90% | |
| Price / MA50: | +1.35% | |
| Price / MA100: | +1.58% | |
| Price / MAexp7: | -0% | |
| Price / MAexp20: | -0.11% | |
| Price / MAexp50: | -0.33% | |
| Price / MAexp100: | -0.11% |
News
The last news published on EXAIL TECHNOLOGIES at the time of the generation of this analysis was as follows:
- Activity of the 3rd quarter 2024: +37% revenue and +139% order intake
- Exail Technologies wins order for deep-sea drone capable of operating at depths of 6,000 m
- Half-year results 2024: current EBITDA margin of 19% and strong improvement in operating cash flows
- Exail Technologies wins a new land defense order in Northern Europe
- Exail Technologies signs a EUR 60 M order for K-STER underwater drones
About author
Online


Add a comment
Comments
0 comments on the analysis EXAIL TECHNOLOGIES - 1H