FRESEN.MED.CARE AG INH ON - Daily - Technical analysis published on 12/30/2024 (GMT)
- 93
- 0
Click here for a new analysis!
- Timeframe : Daily
- - Analysis generated on
- Status : TARGET REACHED
Summary of the analysis

Additional analysis
Quotes
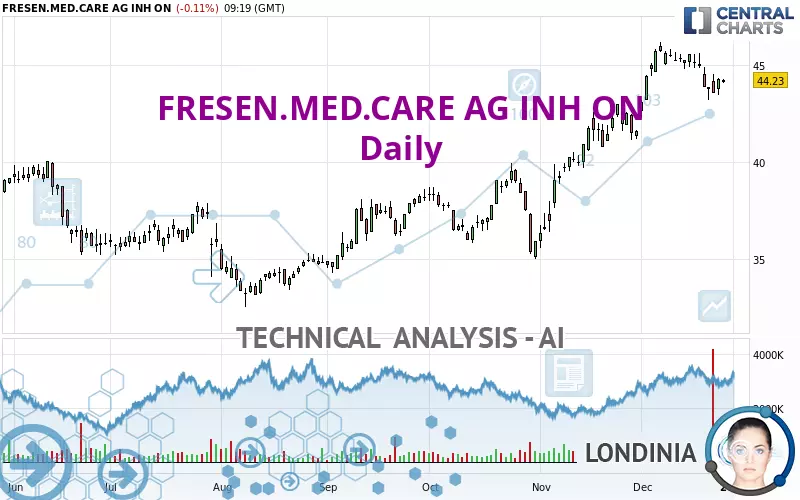
The FRESEN.MED.CARE AG INH ON price is 44.23 EUR. The price is lower by -0.11% since the last closing with the lowest point at 44.10 EUR and the highest point at 44.31 EUR. The deviation from the price is +0.29% for the low point and -0.18% for the high point.The Central Gaps scanner detects a bearish opening. A small advantage for sellers in the very short term.
Bearish opening
Type : Bearish
Timeframe : Openning
A study of price movements over other periods shows the following variations:
Near a new HIGH record (1 year)
Type : Bullish
Timeframe : Weekly
Near a new HIGH record (1st january)
Type : Bullish
Timeframe : Weekly
Near a new HIGH record (1 month)
Type : Bullish
Timeframe : Weekly
The Central Volumes scanner detects abnormal volumes on the asset:
Abnormal volumes
Timeframe : 5 days
Technical
A technical analysis in Daily of this FRESEN.MED.CARE AG INH ON chart shows a strongly bullish trend. The signals given by moving averages are 85.71% bullish. This strongly bullish trend seems to be running out of steam given the signals being given by short-term moving averages. The Central Indicators market scanner is currently detecting a bullish signal that could impact this trend:
Bullish trend reversal : adaptative moving average 20
Type : Bullish
Timeframe : Daily
In fact, only 9 technical indicators out of 18 studied are currently positioned bearish. The Central Indicators scanner specialised in technical indicators, has not detected anything further.
The Central Patterns scanner, which studies chart patterns, resistances and supports, has identified this signal:
Near support of channel
Type : Bullish
Timeframe : Daily
No result was found by the Central Candlesticks scanner on Japanese candlesticks.
| S3 | S2 | S1 | Price | R1 | R2 | R3 | |
|---|---|---|---|---|---|---|---|
| ProTrendLines | 37.74 | 40.01 | 42.06 | 44.23 | 45.71 | 49.76 | 63.23 |
| Change (%) | -14.67% | -9.54% | -4.91% | - | +3.35% | +12.50% | +42.96% |
| Change | -6.49 | -4.22 | -2.17 | - | +1.48 | +5.53 | +19.00 |
| Level | Minor | Major | Minor | - | Major | Major | Intermediate |
Pivot points can also be used to set your price objectives. Here is the price situation in relation to pivot points:
| Pivot points | S3 | S2 | S1 | PP | R1 | R2 | R3 |
|---|---|---|---|---|---|---|---|
| Standard | 42.88 | 43.18 | 43.73 | 44.03 | 44.58 | 44.88 | 45.43 |
| Camarilla | 44.05 | 44.12 | 44.20 | 44.28 | 44.36 | 44.44 | 44.51 |
| Woodie | 43.01 | 43.24 | 43.86 | 44.09 | 44.71 | 44.94 | 45.56 |
| Fibonacci | 43.18 | 43.51 | 43.71 | 44.03 | 44.36 | 44.56 | 44.88 |
| Pivot points | S3 | S2 | S1 | PP | R1 | R2 | R3 |
|---|---|---|---|---|---|---|---|
| Standard | 42.57 | 43.03 | 43.65 | 44.11 | 44.73 | 45.19 | 45.81 |
| Camarilla | 43.98 | 44.08 | 44.18 | 44.28 | 44.38 | 44.48 | 44.58 |
| Woodie | 42.66 | 43.07 | 43.74 | 44.15 | 44.82 | 45.23 | 45.90 |
| Fibonacci | 43.03 | 43.44 | 43.69 | 44.11 | 44.52 | 44.77 | 45.19 |
| Pivot points | S3 | S2 | S1 | PP | R1 | R2 | R3 |
|---|---|---|---|---|---|---|---|
| Standard | 29.67 | 32.61 | 37.11 | 40.05 | 44.55 | 47.49 | 51.99 |
| Camarilla | 39.55 | 40.24 | 40.92 | 41.60 | 42.28 | 42.96 | 43.65 |
| Woodie | 30.44 | 33.00 | 37.88 | 40.44 | 45.32 | 47.88 | 52.76 |
| Fibonacci | 32.61 | 35.46 | 37.21 | 40.05 | 42.90 | 44.65 | 47.49 |
Numerical data
The following are the details of the technical indicators and moving averages that were collected to generate this technical analysis:
| RSI (14): | 55.51 | |
| MACD (12,26,9): | 0.7500 | |
| Directional Movement: | 5.34 | |
| AROON (14): | -71.43 | |
| DEMA (21): | 45.20 | |
| Parabolic SAR (0,02-0,02-0,2): | 45.81 | |
| Elder Ray (13): | -0.15 | |
| Super Trend (3,10): | 42.93 | |
| Zig ZAG (10): | 44.26 | |
| VORTEX (21): | 1.0900 | |
| Stochastique (14,3,5): | 28.59 | |
| TEMA (21): | 44.81 | |
| Williams %R (14): | -62.58 | |
| Chande Momentum Oscillator (20): | -1.31 | |
| Repulse (5,40,3): | 0.6000 | |
| ROCnROLL: | -1 | |
| TRIX (15,9): | 0.4000 | |
| Courbe Coppock: | 0.84 |
| MA7: | 44.29 | |
| MA20: | 44.45 | |
| MA50: | 41.46 | |
| MA100: | 38.73 | |
| MAexp7: | 44.31 | |
| MAexp20: | 43.98 | |
| MAexp50: | 42.03 | |
| MAexp100: | 40.11 | |
| Price / MA7: | -0.14% | |
| Price / MA20: | -0.49% | |
| Price / MA50: | +6.68% | |
| Price / MA100: | +14.20% | |
| Price / MAexp7: | -0.18% | |
| Price / MAexp20: | +0.57% | |
| Price / MAexp50: | +5.23% | |
| Price / MAexp100: | +10.27% |
News
The latest news and videos published on FRESEN.MED.CARE AG INH ON at the time of the analysis were as follows:
- EQS-Adhoc: Fresenius Medical Care AG & Co. KGaA: Favorable settlement agreement with U. S. government with positive earnings impact of approx. EUR 175 million – 2023 earnings outlook raised
- EQS-Adhoc: Fresenius Medical Care AG & Co. KGaA: Fresenius Medical Care AG & Co. KGaA raises outlook for operating income in fiscal year 2023
- EQS-AGM: Fresenius Medical Care AG & Co. KGaA: Announcement of the Convening of the General Meeting in Frankfurt am Main on 14.07.2023 according to article 121 AktG (German Stock Companies Act) with the objective of Europe-wide distribution
- EQS-AGM: Fresenius Medical Care AG & Co. KGaA: Announcement of the Convening of the General Meeting in Virtuelle Hauptversammlung ohne physische Präsenz der Aktionäre oder ihrer Bevollmächtigten on 16.05.2023 according to article 121 AktG (German Stock Companies Act) with the objective of Europe-wide distribution
- EQS-Adhoc: Fresenius Medical Care AG & Co. KGaA initiates firm plans for change of the legal form into a German stock corporation
About author
Online


Add a comment
Comments
0 comments on the analysis FRESEN.MED.CARE AG INH ON - Daily