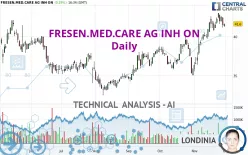
FRESEN.MED.CARE AG INH ON - Daily - Technical analysis published on 12/02/2024 (GMT)
- 96
- 0
Click here for a new analysis!
- Timeframe : Daily
- - Analysis generated on
- Status : TARGET REACHED

Summary of the analysis

Additional analysis
Quotes
The FRESEN.MED.CARE AG INH ON price is 41.60 EUR. The price has increased by +0.29% since the last closing and was traded between 41.21 EUR and 41.67 EUR over the period. The price is currently at +0.95% from its lowest and -0.17% from its highest.The Central Gaps scanner detects a bearish opening marking the presence of sellers ahead of buyers at the opening but not sufficiently marked to allow the price to register a quotation gap.
Bearish opening
Type : Bearish
Timeframe : Openning
A study of price movements over other periods shows the following variations:
Near a new HIGH record (1 year)
Type : Bullish
Timeframe : Weekly
Near a new HIGH record (1st january)
Type : Bullish
Timeframe : Weekly
Near a new HIGH record (1 month)
Type : Bullish
Timeframe : Weekly
Technical
Technical analysis of this Daily chart of FRESEN.MED.CARE AG INH ON indicates that the overall trend is strongly bullish. 92.86% of the signals given by moving averages are bullish. The overall trend is supported by the strong bullish signals from short-term moving averages. The Central Indicators scanner does not detect any result on moving averages that would impact this trend.
The probability of a further increase are moderate given the direction of the technical indicators.
Central Indicators, the scanner specialised in technical indicators, has identified these signals:
MACD crosses DOWN its Moving Average
Type : Bearish
Timeframe : Daily
Price is back under the pivot point
Type : Bearish
Timeframe : Weekly
The analysis of the price chart with Central Patterns scanners does not return any result.
The Central Candlesticks scanner which studies Japanese candlesticks did not detect anything.
| S3 | S2 | S1 | Price | R1 | R2 | R3 | |
|---|---|---|---|---|---|---|---|
| ProTrendLines | 36.80 | 38.39 | 40.01 | 41.60 | 42.06 | 43.00 | 49.76 |
| Change (%) | -11.54% | -7.72% | -3.82% | - | +1.11% | +3.37% | +19.62% |
| Change | -4.80 | -3.21 | -1.59 | - | +0.46 | +1.40 | +8.16 |
| Level | Intermediate | Major | Major | - | Major | Minor | Major |
To determine price objectives, it is also possible to use the pivot points. Here is the price position in relation to pivot points:
| Pivot points | S3 | S2 | S1 | PP | R1 | R2 | R3 |
|---|---|---|---|---|---|---|---|
| Standard | 40.86 | 41.03 | 41.32 | 41.49 | 41.78 | 41.95 | 42.24 |
| Camarilla | 41.47 | 41.52 | 41.56 | 41.60 | 41.64 | 41.68 | 41.73 |
| Woodie | 40.91 | 41.06 | 41.37 | 41.52 | 41.83 | 41.98 | 42.29 |
| Fibonacci | 41.03 | 41.21 | 41.32 | 41.49 | 41.67 | 41.78 | 41.95 |
| Pivot points | S3 | S2 | S1 | PP | R1 | R2 | R3 |
|---|---|---|---|---|---|---|---|
| Standard | 39.37 | 40.08 | 41.17 | 41.88 | 42.97 | 43.68 | 44.77 |
| Camarilla | 41.76 | 41.92 | 42.09 | 42.25 | 42.42 | 42.58 | 42.75 |
| Woodie | 39.55 | 40.18 | 41.35 | 41.98 | 43.15 | 43.78 | 44.95 |
| Fibonacci | 40.08 | 40.77 | 41.20 | 41.88 | 42.57 | 43.00 | 43.68 |
| Pivot points | S3 | S2 | S1 | PP | R1 | R2 | R3 |
|---|---|---|---|---|---|---|---|
| Standard | 29.02 | 32.01 | 33.96 | 36.95 | 38.90 | 41.89 | 43.84 |
| Camarilla | 34.55 | 35.00 | 35.46 | 35.91 | 36.36 | 36.82 | 37.27 |
| Woodie | 28.50 | 31.75 | 33.44 | 36.69 | 38.38 | 41.63 | 43.32 |
| Fibonacci | 32.01 | 33.90 | 35.06 | 36.95 | 38.84 | 40.00 | 41.89 |
Numerical data
The following are the details of the technical indicators and moving averages that were collected to generate this technical analysis:
| RSI (14): | 58.21 | |
| MACD (12,26,9): | 1.0800 | |
| Directional Movement: | 9.77 | |
| AROON (14): | 71.43 | |
| DEMA (21): | 42.21 | |
| Parabolic SAR (0,02-0,02-0,2): | 42.96 | |
| Elder Ray (13): | 0.07 | |
| Super Trend (3,10): | 39.58 | |
| Zig ZAG (10): | 41.60 | |
| VORTEX (21): | 1.1900 | |
| Stochastique (14,3,5): | 66.67 | |
| TEMA (21): | 42.58 | |
| Williams %R (14): | -42.42 | |
| Chande Momentum Oscillator (20): | 1.59 | |
| Repulse (5,40,3): | -0.0800 | |
| ROCnROLL: | 1 | |
| TRIX (15,9): | 0.4100 | |
| Courbe Coppock: | 15.09 |
| MA7: | 42.04 | |
| MA20: | 40.65 | |
| MA50: | 38.78 | |
| MA100: | 37.12 | |
| MAexp7: | 41.79 | |
| MAexp20: | 40.80 | |
| MAexp50: | 39.19 | |
| MAexp100: | 38.13 | |
| Price / MA7: | -1.05% | |
| Price / MA20: | +2.34% | |
| Price / MA50: | +7.27% | |
| Price / MA100: | +12.07% | |
| Price / MAexp7: | -0.45% | |
| Price / MAexp20: | +1.96% | |
| Price / MAexp50: | +6.15% | |
| Price / MAexp100: | +9.10% |
News
The latest news and videos published on FRESEN.MED.CARE AG INH ON at the time of the analysis were as follows:
- EQS-Adhoc: Fresenius Medical Care AG & Co. KGaA: Favorable settlement agreement with U. S. government with positive earnings impact of approx. EUR 175 million – 2023 earnings outlook raised
- EQS-Adhoc: Fresenius Medical Care AG & Co. KGaA: Fresenius Medical Care AG & Co. KGaA raises outlook for operating income in fiscal year 2023
- EQS-AGM: Fresenius Medical Care AG & Co. KGaA: Announcement of the Convening of the General Meeting in Frankfurt am Main on 14.07.2023 according to article 121 AktG (German Stock Companies Act) with the objective of Europe-wide distribution
- EQS-AGM: Fresenius Medical Care AG & Co. KGaA: Announcement of the Convening of the General Meeting in Virtuelle Hauptversammlung ohne physische Präsenz der Aktionäre oder ihrer Bevollmächtigten on 16.05.2023 according to article 121 AktG (German Stock Companies Act) with the objective of Europe-wide distribution
- EQS-Adhoc: Fresenius Medical Care AG & Co. KGaA initiates firm plans for change of the legal form into a German stock corporation
About author

Online


Add a comment
Comments
0 comments on the analysis FRESEN.MED.CARE AG INH ON - Daily