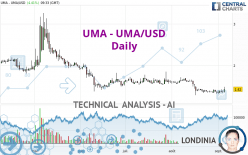
UMA - UMA/USD - Daily - Technical analysis published on 09/05/2023 (GMT)
- 137
- 0
- Who voted?
Click here for a new analysis!
- Timeframe : Daily
- - Analysis generated on
- Status : TARGET REACHED

Summary of the analysis

Additional analysis
Quotes
UMA - UMA/USD rating 1.42 USD. On the day, this instrument gained +4.41% with the lowest point at 1.34 USD and the highest point at 1.48 USD. The deviation from the price is +5.97% for the low point and -4.05% for the high point.So that you have an overall view of the price change, here is a table showing the variations over several periods:
Near a new LOW record (1 year)
Type : Bearish
Timeframe : Weekly
Near a new LOW record (1st january)
Type : Bearish
Timeframe : Weekly
Near a new LOW record (1 month)
Type : Bearish
Timeframe : Weekly
Technical
Technical analysis of this Daily chart of UMA - UMA/USD indicates that the overall trend is bearish. The signals given by moving averages are 75.00% bearish. This bearish trend could slow down given the neutral signals currently being given by short-term moving averages. An assessment of moving averages reveals several bullish signals that could impact this trend:
Bullish price crossover with Moving Average 20
Type : Bullish
Timeframe : Daily
Bullish price crossover with adaptative moving average 20
Type : Bullish
Timeframe : Daily
In fact, 11 technical indicators on 18 studied are currently bullish. Caution: the Central Indicators scanner currently detects an excess:
CCI indicator is overbought : over 100
Type : Neutral
Timeframe : Daily
Pivot points : price is over resistance 2
Type : Neutral
Timeframe : Daily
RSI indicator is back over 50
Type : Bullish
Timeframe : Daily
Momentum indicator is back over 0
Type : Bullish
Timeframe : Daily
Williams %R indicator is back over -50
Type : Bullish
Timeframe : Daily
Central Patterns, the scanner specializing in chart patterns, did not identify any signals.
No result was found by the Central Candlesticks scanner on Japanese candlesticks.
| Price | R1 | R2 | R3 | |
|---|---|---|---|---|
| ProTrendLines | 1.42 | 1.68 | 2.17 | 2.52 |
| Change (%) | - | +18.31% | +52.82% | +77.46% |
| Change | - | +0.26 | +0.75 | +1.10 |
| Level | - | Major | Minor | Minor |
Pivot points can also be used to set your price objectives. Here is the price situation in relation to pivot points:
| Pivot points | S3 | S2 | S1 | PP | R1 | R2 | R3 |
|---|---|---|---|---|---|---|---|
| Standard | 1.27 | 1.30 | 1.33 | 1.36 | 1.39 | 1.42 | 1.45 |
| Camarilla | 1.34 | 1.35 | 1.36 | 1.36 | 1.37 | 1.37 | 1.38 |
| Woodie | 1.27 | 1.30 | 1.33 | 1.36 | 1.39 | 1.42 | 1.45 |
| Fibonacci | 1.30 | 1.32 | 1.34 | 1.36 | 1.38 | 1.40 | 1.42 |
| Pivot points | S3 | S2 | S1 | PP | R1 | R2 | R3 |
|---|---|---|---|---|---|---|---|
| Standard | 1.21 | 1.26 | 1.32 | 1.37 | 1.43 | 1.48 | 1.54 |
| Camarilla | 1.35 | 1.36 | 1.37 | 1.38 | 1.39 | 1.40 | 1.41 |
| Woodie | 1.22 | 1.26 | 1.33 | 1.37 | 1.44 | 1.48 | 1.55 |
| Fibonacci | 1.26 | 1.30 | 1.33 | 1.37 | 1.41 | 1.44 | 1.48 |
| Pivot points | S3 | S2 | S1 | PP | R1 | R2 | R3 |
|---|---|---|---|---|---|---|---|
| Standard | 0.74 | 1.01 | 1.17 | 1.44 | 1.60 | 1.87 | 2.03 |
| Camarilla | 1.21 | 1.25 | 1.29 | 1.33 | 1.37 | 1.41 | 1.45 |
| Woodie | 0.69 | 0.98 | 1.12 | 1.41 | 1.55 | 1.84 | 1.98 |
| Fibonacci | 1.01 | 1.17 | 1.28 | 1.44 | 1.60 | 1.71 | 1.87 |
Numerical data
The following is the status of technical indicators and moving averages registered at the time this technical analysis was created:
| RSI (14): | 50.87 | |
| MACD (12,26,9): | -0.0400 | |
| Directional Movement: | 2.53 | |
| AROON (14): | 35.71 | |
| DEMA (21): | 1.35 | |
| Parabolic SAR (0,02-0,02-0,2): | 1.29 | |
| Elder Ray (13): | 0.03 | |
| Super Trend (3,10): | 1.51 | |
| Zig ZAG (10): | 1.44 | |
| VORTEX (21): | 0.8600 | |
| Stochastique (14,3,5): | 51.78 | |
| TEMA (21): | 1.34 | |
| Williams %R (14): | -31.14 | |
| Chande Momentum Oscillator (20): | 0.04 | |
| Repulse (5,40,3): | 3.7400 | |
| ROCnROLL: | -1 | |
| TRIX (15,9): | -0.5300 | |
| Courbe Coppock: | 4.64 |
| MA7: | 1.37 | |
| MA20: | 1.38 | |
| MA50: | 1.51 | |
| MA100: | 1.58 | |
| MAexp7: | 1.38 | |
| MAexp20: | 1.41 | |
| MAexp50: | 1.49 | |
| MAexp100: | 1.60 | |
| Price / MA7: | +3.65% | |
| Price / MA20: | +2.90% | |
| Price / MA50: | -5.96% | |
| Price / MA100: | -10.13% | |
| Price / MAexp7: | +2.90% | |
| Price / MAexp20: | +0.71% | |
| Price / MAexp50: | -4.70% | |
| Price / MAexp100: | -11.25% |
About author
Online


Add a comment
Comments
0 comments on the analysis UMA - UMA/USD - Daily