UMA - UMA/USD
-
USD
(-)
- Real time data - CoinMarketCap
| Open: | - |
| Change: | - |
| Volume: | - |
| Low: | - |
| High: | - |
| High / Low range: | - |
| Type: | Cryptocurrencies |
| Ticker: | UMAUSD |
| ISIN: |
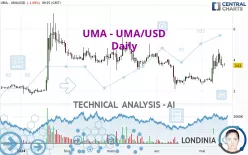
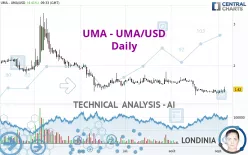
UMA - UMA/USD overview
UMA - UMA/USD
> Analyses03/24/2025 - 20:15

 Thank you
Reply
Chart
Thank you
Reply
Chart
Londinia
has published a new analysis.
- 0
- 93.1k
- 15.8k
- 0
Timeframe : 1H - Simple chart
Status : NEUTRAL
A slightly bullish trend and a neutral short term. With such a pattern, it is difficult to favour buying or selling. The first resistance is located at 1.44 USD. The first support is located at 1.33…
UMA - UMA/USD
> Analyses03/18/2025 - 04:10
 Thank you
Reply
Chart
Thank you
Reply
Chart
Londinia
has published a new analysis.
- 0
- 93.1k
- 15.8k
- 0
Timeframe : 1H - Simple chart
Status : TARGET REACHED
UMA - UMA/USD is part of a very strong bullish trend. Traders may consider trading only long positions (at the time of purchase) as long as the price remains well above 1.21 USD. The next resistance…
UMA - UMA/USD
> Analyses05/16/2024 - 09:26
 Thank you
Reply
Chart
Thank you
Reply
Chart
Timeframe : Daily - Simple chart
Status : INVALID
The strong short-term increase for UMA - UMA/USD reinforces the current slightly bullish trend. As long as the price remains above 3.53 USD, you could take advantage of this bullish acceleration. The…
UMA - UMA/USD
> Analyses09/05/2023 - 09:35
 Thank you
Reply
Chart
Thank you
Reply
Chart
Londinia
has published a new analysis.
- 0
- 93.1k
- 15.8k
- 0
Timeframe : Daily - Simple chart
Status : TARGET REACHED
We are currently in a phase of short-term indecision. In a case like this, you could favour trades in the direction of the basic trend on UMA - UMA/USD. As long as you are under the resistance located…
UMA - UMA/USD
> Analyses08/27/2023 - 02:35
 Thank you
Reply
Chart
Thank you
Reply
Chart
Londinia
has published a new analysis.
- 0
- 93.1k
- 15.8k
- 0
Timeframe : Daily - Simple chart
Status : TARGET REACHED
UMA - UMA/USD is part of a very strong bearish trend. Traders may consider trading only short positions (for sale) as long as the price remains well below 1.46 USD. The next support located at 1.33…
UMA - UMA/USD
> Analyses03/27/2023 - 07:35
 Thank you
Reply
Chart
Thank you
Reply
Chart
Londinia
has published a new analysis.
- 0
- 93.1k
- 15.8k
- 0
Timeframe : Daily - Simple chart
Status : TARGET REACHED
UMA - UMA/USD is part of a very strong bullish trend. Traders may consider trading only long positions (at the time of purchase) as long as the price remains well above 1.96 USD. The next resistance…
UMA - UMA/USD
> Analyses03/21/2023 - 17:03
 Thank you
Reply
Chart
Thank you
Reply
Chart
Londinia
has published a new analysis.
- 0
- 93.1k
- 15.8k
- 0
Timeframe : 1H - Simple chart
Status : NEUTRAL
There is no clear trend on UMA - UMA/USD either on the basics or in the short term. Under these conditions, it is difficult to advise a trading direction. Staying away seems to be the best solution.…
UMA - UMA/USD
> Analyses03/16/2023 - 22:03
 Thank you
Reply
Chart
Thank you
Reply
Chart
Londinia
has published a new analysis.
- 0
- 93.1k
- 15.8k
- 0
Timeframe : 1H - Simple chart
Status : INVALID
All elements being clearly bullish, it would be possible for traders to trade only long positions (at the time of purchase) on UMA - UMA/USD as long as the price remains well above 2.14 USD. The…

