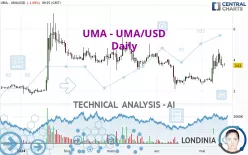
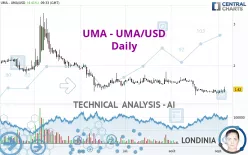
UMA - UMA/USD Technical Analyses
UMA - UMA/USD - More technical analyses...
- 0
- 92806
- 15749
- 0

Status : NEUTRAL
Simple chart
- 79
- 0
- 0
- 0
- 92806
- 15749
- 0

Status : TARGET REACHED
Simple chart
- 104
- 0
- 0
- 0
- 92806
- 15749
- 0
Status : INVALID
Simple chart
- 115
- 0
- 0
- 0
- 92806
- 15749
- 0
Status : TARGET REACHED
Simple chart
- 155
- 0
- 1
- 0
- 92806
- 15749
- 0

Status : TARGET REACHED
Simple chart
- 176
- 0
- 0
- 0
- 92806
- 15749
- 0

Status : TARGET REACHED
Simple chart
- 177
- 0
- 0
- 0
- 92806
- 15749
- 0

Status : NEUTRAL
Simple chart
- 161
- 0
- 0
- 0
- 92806
- 15749
- 0

Status : INVALID
Simple chart
- 229
- 0
- 0
- 0
- 92806
- 15749
- 0

Status : INVALID
Simple chart
- 167
- 0
- 0
- 0
- 92806
- 15749
- 0

Status : NEUTRAL
Simple chart
- 156
- 0
- 0
- 0
- 92806
- 15749
- 0

Status : TARGET REACHED
Simple chart
- 184
- 0
- 0
- 0
- 92806
- 15749
- 0

Status : TARGET REACHED
Simple chart
- 168
- 0
- 0

