FORD MOTOR COMPANY - 1H - Technical analysis published on 07/12/2024 (GMT)
- 147
- 0
Click here for a new analysis!
- Timeframe : 1H
- - Analysis generated on
- Status : TARGET REACHED
Summary of the analysis

Additional analysis
Quotes
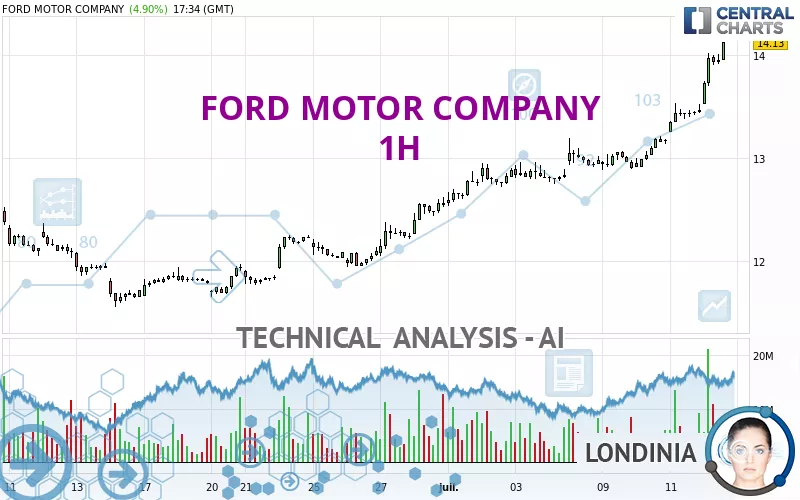
The FORD MOTOR COMPANY rating is 14.12 USD. The price registered an increase of +4.83% on the session and was between 13.53 USD and 14.13 USD. This implies that the price is at +4.36% from its lowest and at -0.07% from its highest.Here is a more detailed summary of the historical variations registered by FORD MOTOR COMPANY:
Near a new HIGH record (1 year)
Type : Bullish
Timeframe : Weekly
New HIGH record (1st january)
Type : Bullish
Timeframe : Weekly
New HIGH record (1 month)
Type : Bullish
Timeframe : Weekly
Technical
A technical analysis in 1H of this FORD MOTOR COMPANY chart shows a strongly bullish trend. The signals given by the moving averages are 92.86% bullish. This strong bullish trend is confirmed by the strong signals currently being given by short-term moving averages. The Central Indicators scanner does not detect any result on moving averages that would impact this trend.
In fact, 16 technical indicators on 18 studied are currently positioned bullish. But beware of excesses. The Central Indicators scanner currently detects this:
RSI indicator is overbought : over 80
Type : Neutral
Timeframe : 1 hour
CCI indicator is overbought : over 100
Type : Neutral
Timeframe : 1 hour
Williams %R indicator is overbought : over -20
Type : Neutral
Timeframe : 1 hour
Pivot points : price is over resistance 3
Type : Neutral
Timeframe : 1 hour
Pivot points : price is over resistance 3
Type : Neutral
Timeframe : Weekly
An analysis of the price chart with the Central Patterns scanner (detector of chart patterns and resistances and supports) shows a result that can have an impact on the price change:
Resistance of channel is broken
Type : Bullish
Timeframe : 1 hour
No result was found by the Central Candlesticks scanner on Japanese candlesticks.
| S3 | S2 | S1 | Price | R1 | R2 | R3 | |
|---|---|---|---|---|---|---|---|
| ProTrendLines | 12.52 | 12.77 | 13.49 | 14.12 | 14.57 | 16.56 | 18.56 |
| Change (%) | -11.33% | -9.56% | -4.46% | - | +3.19% | +17.28% | +31.44% |
| Change | -1.60 | -1.35 | -0.63 | - | +0.45 | +2.44 | +4.44 |
| Level | Minor | Major | Major | - | Intermediate | Minor | Minor |
Attention could also be paid to pivot points to set price objectives:
| Pivot points | S3 | S2 | S1 | PP | R1 | R2 | R3 |
|---|---|---|---|---|---|---|---|
| Standard | 13.01 | 13.13 | 13.30 | 13.42 | 13.59 | 13.71 | 13.88 |
| Camarilla | 13.39 | 13.42 | 13.44 | 13.47 | 13.50 | 13.52 | 13.55 |
| Woodie | 13.04 | 13.14 | 13.33 | 13.43 | 13.62 | 13.72 | 13.91 |
| Fibonacci | 13.13 | 13.24 | 13.31 | 13.42 | 13.53 | 13.60 | 13.71 |
| Pivot points | S3 | S2 | S1 | PP | R1 | R2 | R3 |
|---|---|---|---|---|---|---|---|
| Standard | 12.16 | 12.35 | 12.59 | 12.78 | 13.02 | 13.21 | 13.45 |
| Camarilla | 12.72 | 12.76 | 12.80 | 12.84 | 12.88 | 12.92 | 12.96 |
| Woodie | 12.20 | 12.36 | 12.63 | 12.79 | 13.06 | 13.22 | 13.49 |
| Fibonacci | 12.35 | 12.51 | 12.61 | 12.78 | 12.94 | 13.04 | 13.21 |
| Pivot points | S3 | S2 | S1 | PP | R1 | R2 | R3 |
|---|---|---|---|---|---|---|---|
| Standard | 10.78 | 11.17 | 11.85 | 12.24 | 12.92 | 13.31 | 13.99 |
| Camarilla | 12.25 | 12.34 | 12.44 | 12.54 | 12.64 | 12.74 | 12.83 |
| Woodie | 10.94 | 11.24 | 12.01 | 12.31 | 13.08 | 13.38 | 14.15 |
| Fibonacci | 11.17 | 11.58 | 11.83 | 12.24 | 12.65 | 12.90 | 13.31 |
Numerical data
The following are the details of the technical indicators and moving averages that were collected to generate this technical analysis:
| RSI (14): | 87.90 | |
| MACD (12,26,9): | 0.2600 | |
| Directional Movement: | 46.24 | |
| AROON (14): | 100.00 | |
| DEMA (21): | 13.82 | |
| Parabolic SAR (0,02-0,02-0,2): | 13.49 | |
| Elder Ray (13): | 0.35 | |
| Super Trend (3,10): | 13.65 | |
| Zig ZAG (10): | 14.05 | |
| VORTEX (21): | 1.3500 | |
| Stochastique (14,3,5): | 94.04 | |
| TEMA (21): | 13.96 | |
| Williams %R (14): | -3.23 | |
| Chande Momentum Oscillator (20): | 0.87 | |
| Repulse (5,40,3): | 1.6300 | |
| ROCnROLL: | 1 | |
| TRIX (15,9): | 0.2100 | |
| Courbe Coppock: | 10.98 |
| MA7: | 13.18 | |
| MA20: | 12.51 | |
| MA50: | 12.28 | |
| MA100: | 12.37 | |
| MAexp7: | 13.83 | |
| MAexp20: | 13.51 | |
| MAexp50: | 13.15 | |
| MAexp100: | 12.82 | |
| Price / MA7: | +7.13% | |
| Price / MA20: | +12.87% | |
| Price / MA50: | +14.98% | |
| Price / MA100: | +14.15% | |
| Price / MAexp7: | +2.10% | |
| Price / MAexp20: | +4.52% | |
| Price / MAexp50: | +7.38% | |
| Price / MAexp100: | +10.14% |
News
Don't forget to follow the news on FORD MOTOR COMPANY. At the time of publication of this analysis, the latest news was as follows:
-
 Ford Recalls 2011-2017 Exporer SUVs For Potential Steering Problem
-
Ford Recalls 1.2M Explorers
-
Ford Recalls 1.2 Million Explorers Over Suspension Issue
-
Inside the new Ford Police Interceptor
- Military AutoSource (MAS) and Ford Motor Company Partner to Launch Operation Homeward Bound Contest
About author
Online


Add a comment
Comments
0 comments on the analysis FORD MOTOR COMPANY - 1H