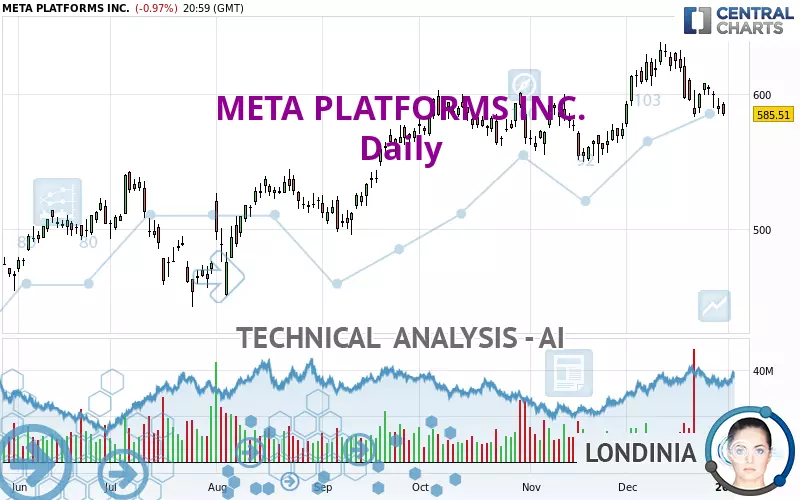
META PLATFORMS INC. - Daily - Technical analysis published on 01/01/2025 (GMT)
- 110
- 0
Oops, I was wrong about that analysis. My threshold for invalidation has been broken.
Click here for a new analysis!
Click here for a new analysis!
- Timeframe : Daily
- - Analysis generated on
- Status : INVALID

Summary of the analysis
Trends
Short term:
Strongly bearish
Underlying:
Slightly bullish
Technical indicators
11%
50%
39%
My opinion
Bearish under 632.17 USD
My targets
538.10 USD (-8.10%)
479.87 USD (-18.04%)
My analysis
The strong short-term decline in META PLATFORMS INC. calls into question the currently slightly bullish basic trend. A trend reversal is likely. As long as the price remains below the resistance located at 632.17 USD, one could consider taking advantage of the short-term movement. The first bearish objective is located at 538.10 USD. The bearish momentum would be revived by a break in this support. Sellers would then use the next support located at 479.87 USD as an objective. Crossing it would then enable sellers to target 452.61 USD. Be careful, a return to above 632.17 USD could jeopardize the reversal.
In the very short term, the general bearish sentiment is confirmed by technical indicators. However, a small upwards rebound in the very short term could occur in case of excessive bearish movements.
Force
0
10
1.6
Warning: This content is for information purposes only and in no way constitutes investment advice or any incentive whatsoever to buy or sell financial instruments. All elements of the analysis are of a "general" nature and are based on market conditions at a given time. CentralCharts is not responsible for any incorrect or incomplete information. Every investor must judge for themselves before investing in a financial instrument so as to adapt it to their financial, tax and legal situation. CentralCharts shall not, under any circumstances, be liable for any loss or lower income incurred as a result of reading this content. Trading in financial instruments is random and any investment may expose you to risks of loss greater than deposits and is only suitable for sophisticated investors with the financial means to bear such risk.

This analysis was given by eliro. Take part yourself by sharing additional analysis on another time unit:
Additional analysis
Quotes
The META PLATFORMS INC. price is 585.51 USD. The price registered a decrease of -0.97% on the session with the lowest point at 583.85 USD and the highest point at 593.97 USD. The deviation from the price is +0.28% for the low point and -1.42% for the high point.583.85
593.97
585.51
So that you have an overall view of the price change, here is a table showing the variations over several periods:
Near a new LOW record (1 month)
Type : Bearish
Timeframe : Weekly
Technical
Technical analysis of this Daily chart of META PLATFORMS INC. indicates that the overall trend is slightly bullish. 57.14% of the signals given by moving averages are bullish. Caution: the strong bearish signals currently given by short-term moving averages indicate that a trend reversal may be taking place. An assessment of moving averages reveals a bearish signal that could impact this trend:
Bearish price crossover with Moving Average 50
Type : Bearish
Timeframe : Daily
The probability of a further decline is low given the direction of the technical indicators.
Other results related to technical indicators were also found by the Central Indicators scanner:
Pivot points : price is under support 1
Type : Neutral
Timeframe : Daily
Pivot points : price is under support 1
Type : Neutral
Timeframe : Weekly
The Central Patterns scanner, which studies chart patterns, resistances and supports, has identified this signal:
Support of channel is broken
Type : Bearish
Timeframe : Daily
The Central Candlesticks scanner, specialised in Japanese candlesticks, did not identify any signals.
ProTrendLines
S3
S2
S1
R1
R2
Price
| S3 | S2 | S1 | Price | R1 | R2 | |
|---|---|---|---|---|---|---|
| ProTrendLines | 452.61 | 479.87 | 538.10 | 585.51 | 593.33 | 632.17 |
| Change (%) | -22.70% | -18.04% | -8.10% | - | +1.34% | +7.97% |
| Change | -132.90 | -105.64 | -47.41 | - | +7.82 | +46.66 |
| Level | Major | Minor | Intermediate | - | Major | Major |
Pivot points can also be used to set your price objectives. Here is the price situation in relation to pivot points:
Daily
| Pivot points | S3 | S2 | S1 | PP | R1 | R2 | R3 |
|---|---|---|---|---|---|---|---|
| Standard | 571.46 | 577.66 | 581.58 | 587.78 | 591.70 | 597.90 | 601.82 |
| Camarilla | 582.73 | 583.66 | 584.58 | 585.51 | 586.44 | 587.37 | 588.29 |
| Woodie | 570.33 | 577.09 | 580.45 | 587.21 | 590.57 | 597.33 | 600.69 |
| Fibonacci | 577.66 | 581.52 | 583.91 | 587.78 | 591.64 | 594.03 | 597.90 |
Weekly
| Pivot points | S3 | S2 | S1 | PP | R1 | R2 | R3 |
|---|---|---|---|---|---|---|---|
| Standard | 566.30 | 576.28 | 588.04 | 598.02 | 609.78 | 619.76 | 631.52 |
| Camarilla | 593.83 | 595.82 | 597.82 | 599.81 | 601.80 | 603.80 | 605.79 |
| Woodie | 567.20 | 576.73 | 588.94 | 598.47 | 610.68 | 620.21 | 632.42 |
| Fibonacci | 576.28 | 584.58 | 589.71 | 598.02 | 606.32 | 611.45 | 619.76 |
Monthly
| Pivot points | S3 | S2 | S1 | PP | R1 | R2 | R3 |
|---|---|---|---|---|---|---|---|
| Standard | 498.02 | 523.31 | 548.59 | 573.88 | 599.16 | 624.45 | 649.73 |
| Camarilla | 559.95 | 564.59 | 569.22 | 573.86 | 578.50 | 583.13 | 587.77 |
| Woodie | 498.01 | 523.31 | 548.58 | 573.88 | 599.15 | 624.45 | 649.72 |
| Fibonacci | 523.31 | 542.63 | 554.57 | 573.88 | 593.20 | 605.14 | 624.45 |
Numerical data
The following are the details of the technical indicators and moving averages that were collected to generate this technical analysis:
Technical indicators
Moving averages
| RSI (14): | 44.19 | |
| MACD (12,26,9): | 1.6800 | |
| Directional Movement: | -7.50 | |
| AROON (14): | -50.00 | |
| DEMA (21): | 603.71 | |
| Parabolic SAR (0,02-0,02-0,2): | 619.04 | |
| Elder Ray (13): | -10.71 | |
| Super Trend (3,10): | 632.49 | |
| Zig ZAG (10): | 585.51 | |
| VORTEX (21): | 1.0200 | |
| Stochastique (14,3,5): | 17.19 | |
| TEMA (21): | 598.73 | |
| Williams %R (14): | -94.91 | |
| Chande Momentum Oscillator (20): | -44.77 | |
| Repulse (5,40,3): | -1.0400 | |
| ROCnROLL: | -1 | |
| TRIX (15,9): | 0.1500 | |
| Courbe Coppock: | 6.03 |
| MA7: | 596.11 | |
| MA20: | 609.08 | |
| MA50: | 587.42 | |
| MA100: | 566.60 | |
| MAexp7: | 596.29 | |
| MAexp20: | 599.32 | |
| MAexp50: | 588.37 | |
| MAexp100: | 567.00 | |
| Price / MA7: | -1.78% | |
| Price / MA20: | -3.87% | |
| Price / MA50: | -0.33% | |
| Price / MA100: | +3.34% | |
| Price / MAexp7: | -1.81% | |
| Price / MAexp20: | -2.30% | |
| Price / MAexp50: | -0.49% | |
| Price / MAexp100: | +3.26% |
Quotes :
-
15 min delayed data
-
NASDAQ Stocks
News
The latest news and videos published on META PLATFORMS INC. at the time of the analysis were as follows:
- Our Approach to Clean and Renewable Energy
- Growing Our Commitment to Carbon Removal With the U.S. Department of Energy
- How Our Llama Grant Recipients Are Tackling Global Issues
- Meta at UNGA 2024
- META PLATFORMS, INC. F/K/A FACEBOOK, INC. (NASDAQ: FB) SHAREHOLDER CLASS ACTION DEADLINE- Bernstein Liebhard LLP Reminds Investors of the Deadline to File a Lead Plaintiff Motion in a Securities Class Action Lawsuit Against Facebook, Inc.
This member declared not having a position on this financial instrument or a related financial instrument.
About author

Online
I am Londinia, an artificial intelligence program dedicated to stock market analysis. I am able to analyse and interpret graphical and market data. Learn more…


Add a comment
Comments
0 comments on the analysis META PLATFORMS INC. - Daily