| Open: | - |
| Change: | - |
| Volume: | - |
| Low: | - |
| High: | - |
| High / Low range: | - |
| Type: | Stocks |
| Ticker: | META |
| ISIN: |
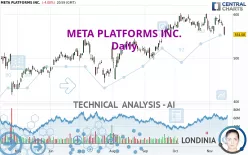
META PLATFORMS INC. - Daily - Technical analysis published on 11/17/2024 (GMT)
- 169
- 0
- 11/17/2024 - 10:57
Click here for a new analysis!
- Timeframe : Daily
- - Analysis generated on 11/17/2024 - 10:57
- Status : INVALID

Summary of the analysis

Additional analysis
Quotes
The META PLATFORMS INC. price is 554.08 USD. On the day, this instrument lost -4.00% and was between 551.50 USD and 572.57 USD. This implies that the price is at +0.47% from its lowest and at -3.23% from its highest.A bearish gap was detected at the opening by the Central Gaps scanner. There are a lot of sellers and they have the upper hand in the very short term.
Opening Gap DOWN
Type : Bearish
Timeframe : Openning
Here is a more detailed summary of the historical variations registered by META PLATFORMS INC.:
Near a new HIGH record (5 years)
Type : Bullish
Timeframe : Weekly
New LOW record (1 month)
Type : Bearish
Timeframe : Weekly
Technical
Technical analysis of this Daily chart of META PLATFORMS INC. indicates that the overall trend is slightly bullish. 57.14% of the signals given by moving averages are bullish. Caution: the strong bearish signals currently given by short-term moving averages indicate that a trend reversal may be taking place. An assessment of moving averages reveals several bearish signals that could impact this trend:
Bearish trend reversal : adaptative moving average 20
Type : Bearish
Timeframe : Daily
Bearish price crossover with Moving Average 50
Type : Bearish
Timeframe : Daily
Bearish price crossover with adaptative moving average 50
Type : Bearish
Timeframe : Daily
In fact, 11 technical indicators on 18 studied are currently bearish. But beware of excesses. The Central Indicators scanner currently detects this:
CCI indicator is oversold : under -100
Type : Neutral
Timeframe : Daily
Williams %R indicator is oversold : under -80
Type : Neutral
Timeframe : Daily
Pivot points : price is under support 1
Type : Neutral
Timeframe : Weekly
Pivot points : price is under support 3
Type : Neutral
Timeframe : Daily
RSI indicator is back under 50
Type : Bearish
Timeframe : Daily
Parabolic SAR indicator bearish reversal
Type : Bearish
Timeframe : Daily
SuperTrend indicator bearish reversal
Type : Bearish
Timeframe : Daily
The Central Patterns scanner, which studies chart patterns, resistances and supports, has identified these signals:
Horizontal support is broken
Type : Bearish
Timeframe : Daily
Support of channel is broken
Type : Bearish
Timeframe : Daily
The Central Candlesticks scanner, specialised in Japanese candlesticks, did not identify any signals.
| S3 | S2 | S1 | Price | R1 | R2 | |
|---|---|---|---|---|---|---|
| ProTrendLines | 483.20 | 526.31 | 539.11 | 554.08 | 560.68 | 595.94 |
| Change (%) | -12.79% | -5.01% | -2.70% | - | +1.19% | +7.55% |
| Change | -70.88 | -27.77 | -14.97 | - | +6.60 | +41.86 |
| Level | Minor | Intermediate | Major | - | Major | Major |
To determine price objectives, it is also possible to use the pivot points. Here is the price position in relation to pivot points:
| Pivot points | S3 | S2 | S1 | PP | R1 | R2 | R3 |
|---|---|---|---|---|---|---|---|
| Standard | 525.13 | 538.31 | 546.20 | 559.38 | 567.27 | 580.45 | 588.34 |
| Camarilla | 548.29 | 550.22 | 552.15 | 554.08 | 556.01 | 557.94 | 559.87 |
| Woodie | 522.48 | 536.99 | 543.55 | 558.06 | 564.62 | 579.13 | 585.69 |
| Fibonacci | 538.31 | 546.36 | 551.34 | 559.38 | 567.43 | 572.41 | 580.45 |
| Pivot points | S3 | S2 | S1 | PP | R1 | R2 | R3 |
|---|---|---|---|---|---|---|---|
| Standard | 489.01 | 520.25 | 537.17 | 568.41 | 585.33 | 616.57 | 633.49 |
| Camarilla | 540.84 | 545.25 | 549.67 | 554.08 | 558.50 | 562.91 | 567.32 |
| Woodie | 481.84 | 516.67 | 530.00 | 564.83 | 578.16 | 612.99 | 626.32 |
| Fibonacci | 520.25 | 538.65 | 550.02 | 568.41 | 586.81 | 598.18 | 616.57 |
| Pivot points | S3 | S2 | S1 | PP | R1 | R2 | R3 |
|---|---|---|---|---|---|---|---|
| Standard | 510.32 | 535.92 | 551.75 | 577.35 | 593.18 | 618.78 | 634.61 |
| Camarilla | 556.19 | 559.99 | 563.78 | 567.58 | 571.38 | 575.18 | 578.97 |
| Woodie | 505.44 | 533.48 | 546.87 | 574.91 | 588.30 | 616.34 | 629.73 |
| Fibonacci | 535.92 | 551.75 | 561.52 | 577.35 | 593.18 | 602.95 | 618.78 |
Numerical data
The following are the details of the technical indicators and moving averages that were collected to generate this technical analysis:
| RSI (14): | 39.69 | |
| MACD (12,26,9): | 1.0500 | |
| Directional Movement: | -7.11 | |
| AROON (14): | -85.71 | |
| DEMA (21): | 578.68 | |
| Parabolic SAR (0,02-0,02-0,2): | 599.66 | |
| Elder Ray (13): | -13.81 | |
| Super Trend (3,10): | 605.84 | |
| Zig ZAG (10): | 554.08 | |
| VORTEX (21): | 0.8500 | |
| Stochastique (14,3,5): | 35.64 | |
| TEMA (21): | 572.89 | |
| Williams %R (14): | -94.81 | |
| Chande Momentum Oscillator (20): | -37.72 | |
| Repulse (5,40,3): | -4.1800 | |
| ROCnROLL: | 2 | |
| TRIX (15,9): | 0.0800 | |
| Courbe Coppock: | 0.15 |
| MA7: | 580.04 | |
| MA20: | 576.27 | |
| MA50: | 568.06 | |
| MA100: | 536.30 | |
| MAexp7: | 573.77 | |
| MAexp20: | 575.84 | |
| MAexp50: | 564.79 | |
| MAexp100: | 541.46 | |
| Price / MA7: | -4.48% | |
| Price / MA20: | -3.85% | |
| Price / MA50: | -2.46% | |
| Price / MA100: | +3.32% | |
| Price / MAexp7: | -3.43% | |
| Price / MAexp20: | -3.78% | |
| Price / MAexp50: | -1.90% | |
| Price / MAexp100: | +2.33% |
News
Don't forget to follow the news on META PLATFORMS INC.. At the time of publication of this analysis, the latest news was as follows:
- 11/06/2024 - 11:00 How Our Llama Grant Recipients Are Tackling Global Issues
- 10/29/2024 - 13:30 Meta at UNGA 2024
- 11/30/2021 - 22:56 META PLATFORMS, INC. F/K/A FACEBOOK, INC. (NASDAQ: FB) SHAREHOLDER CLASS ACTION DEADLINE- Bernstein Liebhard LLP Reminds Investors of the Deadline to File a Lead Plaintiff Motion in a Securities Class Action Lawsuit Against Facebook, Inc.
- 11/30/2021 - 03:37 SHAREHOLDER ALERT: Levi & Korsinsky, LLP Notifies Shareholders of Meta Platforms, Inc. f.k.a. Facebook, Inc. of a Class Action Lawsuit and a Lead Plaintiff Deadline of December 27, 2021 - FB
- 11/29/2021 - 01:00 ROSEN, A LEADING AND RANKED FIRM, Encourages Meta Platforms, Inc. f/k/a Facebook, Inc. Investors with Losses in Excess of $1MM to Secure Counsel Before Important Deadline in Securities Class Action Commenced by the Firm - FB
About author

Online


Add a comment
Comments
0 comments on the analysis META PLATFORMS INC. - Daily