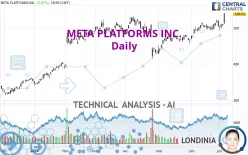
META PLATFORMS INC. - Daily - Technical analysis published on 07/07/2024 (GMT)
- 190
- 0
Click here for a new analysis!
- Timeframe : Daily
- - Analysis generated on
- Status : INVALID

Summary of the analysis

Additional analysis
Quotes
The META PLATFORMS INC. rating is 539.91 USD. The price has increased by +5.87% since the last closing and was traded between 511.60 USD and 540.87 USD over the period. The price is currently at +5.53% from its lowest and -0.18% from its highest.A bullish gap was detected at the opening by the Central Gaps scanner. There are a lot of buyers and they have the upper hand in the very short term.
Opening Gap UP
Type : Bullish
Timeframe : Openning
Here is a more detailed summary of the historical variations registered by META PLATFORMS INC.:
New HIGH record (5 years)
Type : Bullish
Timeframe : Weekly
New HIGH record (1 year)
Type : Bullish
Timeframe : Weekly
New HIGH record (1st january)
Type : Bullish
Timeframe : Weekly
New HIGH record (1 month)
Type : Bullish
Timeframe : Weekly
Technical
Technical analysis of this Daily chart of META PLATFORMS INC. indicates that the overall trend is strongly bullish. 89.29% of the signals given by moving averages are bullish. This strongly bullish trend is supported by the strong bullish signals given by short-term moving averages. There is no crossing of moving average by the price or crossing of moving averages between themselves.
In fact, 14 technical indicators on 18 studied are currently bullish. Caution: the Central Indicators scanner currently detects an excess:
RSI indicator is overbought : over 70
Type : Neutral
Timeframe : Daily
CCI indicator is overbought : over 100
Type : Neutral
Timeframe : Daily
Williams %R indicator is overbought : over -20
Type : Neutral
Timeframe : Daily
Pivot points : price is over resistance 2
Type : Neutral
Timeframe : Weekly
Pivot points : price is over resistance 3
Type : Neutral
Timeframe : Daily
MACD crosses UP its Moving Average
Type : Bullish
Timeframe : Daily
Parabolic SAR indicator bullish reversal
Type : Bullish
Timeframe : Daily
Central Patterns, the market scanner focusing on chart patterns, resistances and supports found this result:
Near horizontal support
Type : Bullish
Timeframe : Daily
Central Candlesticks, the scanner specialised in Japanese candlesticks, detects a bullish signal that could support the hypothesis of a small rebound in the very short term:
Upside gap
Type : Bullish
Timeframe : Daily
| S3 | S2 | S1 | Price | |
|---|---|---|---|---|
| ProTrendLines | 429.74 | 482.33 | 526.82 | 539.91 |
| Change (%) | -20.41% | -10.66% | -2.42% | - |
| Change | -110.17 | -57.58 | -13.09 | - |
| Level | Intermediate | Major | Major | - |
Attention could also be paid to pivot points to set price objectives:
| Pivot points | S3 | S2 | S1 | PP | R1 | R2 | R3 |
|---|---|---|---|---|---|---|---|
| Standard | 491.45 | 501.52 | 520.72 | 530.79 | 549.99 | 560.06 | 579.26 |
| Camarilla | 531.86 | 534.54 | 537.23 | 539.91 | 542.59 | 545.28 | 547.96 |
| Woodie | 496.01 | 503.80 | 525.28 | 533.07 | 554.55 | 562.34 | 583.82 |
| Fibonacci | 501.52 | 512.70 | 519.61 | 530.79 | 541.97 | 548.88 | 560.06 |
| Pivot points | S3 | S2 | S1 | PP | R1 | R2 | R3 |
|---|---|---|---|---|---|---|---|
| Standard | 460.73 | 476.95 | 508.43 | 524.65 | 556.13 | 572.35 | 603.83 |
| Camarilla | 526.79 | 531.17 | 535.54 | 539.91 | 544.28 | 548.66 | 553.03 |
| Woodie | 468.36 | 480.77 | 516.06 | 528.47 | 563.76 | 576.17 | 611.46 |
| Fibonacci | 476.95 | 495.17 | 506.43 | 524.65 | 542.87 | 554.13 | 572.35 |
| Pivot points | S3 | S2 | S1 | PP | R1 | R2 | R3 |
|---|---|---|---|---|---|---|---|
| Standard | 418.61 | 443.19 | 473.71 | 498.29 | 528.81 | 553.39 | 583.91 |
| Camarilla | 489.07 | 494.12 | 499.17 | 504.22 | 509.27 | 514.32 | 519.37 |
| Woodie | 421.57 | 444.68 | 476.67 | 499.78 | 531.77 | 554.88 | 586.87 |
| Fibonacci | 443.19 | 464.24 | 477.25 | 498.29 | 519.34 | 532.35 | 553.39 |
Numerical data
The following is the status of the technical indicators and moving averages at the time of publication of this technical analysis:
| RSI (14): | 71.24 | |
| MACD (12,26,9): | 9.5700 | |
| Directional Movement: | 18.33 | |
| AROON (14): | 64.29 | |
| DEMA (21): | 517.19 | |
| Parabolic SAR (0,02-0,02-0,2): | 493.17 | |
| Elder Ray (13): | 15.96 | |
| Super Trend (3,10): | 487.16 | |
| Zig ZAG (10): | 539.91 | |
| VORTEX (21): | 1.1100 | |
| Stochastique (14,3,5): | 70.59 | |
| TEMA (21): | 521.79 | |
| Williams %R (14): | -1.98 | |
| Chande Momentum Oscillator (20): | 33.28 | |
| Repulse (5,40,3): | 8.4700 | |
| ROCnROLL: | 1 | |
| TRIX (15,9): | 0.2500 | |
| Courbe Coppock: | 5.49 |
| MA7: | 514.42 | |
| MA20: | 506.20 | |
| MA50: | 481.83 | |
| MA100: | 488.10 | |
| MAexp7: | 516.06 | |
| MAexp20: | 505.10 | |
| MAexp50: | 492.07 | |
| MAexp100: | 471.85 | |
| Price / MA7: | +4.96% | |
| Price / MA20: | +6.66% | |
| Price / MA50: | +12.05% | |
| Price / MA100: | +10.61% | |
| Price / MAexp7: | +4.62% | |
| Price / MAexp20: | +6.89% | |
| Price / MAexp50: | +9.72% | |
| Price / MAexp100: | +14.42% |
News
The latest news and videos published on META PLATFORMS INC. at the time of the analysis were as follows:
- META PLATFORMS, INC. F/K/A FACEBOOK, INC. (NASDAQ: FB) SHAREHOLDER CLASS ACTION DEADLINE- Bernstein Liebhard LLP Reminds Investors of the Deadline to File a Lead Plaintiff Motion in a Securities Class Action Lawsuit Against Facebook, Inc.
- SHAREHOLDER ALERT: Levi & Korsinsky, LLP Notifies Shareholders of Meta Platforms, Inc. f.k.a. Facebook, Inc. of a Class Action Lawsuit and a Lead Plaintiff Deadline of December 27, 2021 - FB
- ROSEN, A LEADING AND RANKED FIRM, Encourages Meta Platforms, Inc. f/k/a Facebook, Inc. Investors with Losses in Excess of $1MM to Secure Counsel Before Important Deadline in Securities Class Action Commenced by the Firm - FB
- Levi & Korsinsky, LLP, Researching Possible Securities Law Violations - Meta Platforms, Inc. f.k.a. Facebook, Inc. - FB
- INVESTOR ACTION REMINDER: The Schall Law Firm Reminds Investors of a Class Action Lawsuit Against Meta Platforms, Inc. f/k/a Facebook, Inc. and Encourages Investors with Losses in Excess of $100,000 to Contact the Firm
About author

Online


Add a comment
Comments
0 comments on the analysis META PLATFORMS INC. - Daily