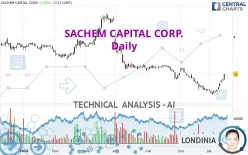
SACHEM CAPITAL CORP. - Daily - Technical analysis published on 07/16/2024 (GMT)
- 135
- 0
Click here for a new analysis!
- Timeframe : Daily
- - Analysis generated on
- Status : INVALID

Summary of the analysis

Additional analysis
Quotes
The SACHEM CAPITAL CORP. price is 2.99 USD. The price has increased by +4.91% since the last closing and was between 2.85 USD and 3.00 USD. This implies that the price is at +4.91% from its lowest and at -0.33% from its highest.A study of price movements over other periods shows the following variations:
New HIGH record (1 month)
Type : Bullish
Timeframe : Weekly
Technical
A technical analysis in Daily of this SACHEM CAPITAL CORP. chart shows a slightly bearish trend. 57.14% of the signals given by moving averages are bearish. Caution: the strong bullish signals currently being given by short-term moving averages could quickly lead to a reversal of the trend. The Central Indicators scanner detects a bullish signal on moving averages that could impact this trend:
Bullish price crossover with Moving Average 50
Type : Bullish
Timeframe : Daily
Technical indicators are strongly bullish, suggesting that the price increase should continue.
But beware of excesses. The Central Indicators scanner currently detects this:
CCI indicator is overbought : over 100
Type : Neutral
Timeframe : Daily
Williams %R indicator is overbought : over -20
Type : Neutral
Timeframe : Daily
Pivot points : price is over resistance 1
Type : Neutral
Timeframe : Weekly
Pivot points : price is over resistance 3
Type : Neutral
Timeframe : Daily
Central Patterns, the market scanner focusing on chart patterns, resistances and supports found these results:
Near horizontal resistance
Type : Bearish
Timeframe : Daily
Resistance of channel is broken
Type : Bullish
Timeframe : Daily
The Central Candlesticks scanner which studies Japanese candlesticks did not detect anything.
| S2 | S1 | Price | R1 | R2 | R3 | |
|---|---|---|---|---|---|---|
| ProTrendLines | 2.63 | 2.92 | 2.99 | 3.43 | 3.72 | 4.40 |
| Change (%) | -12.04% | -2.34% | - | +14.72% | +24.41% | +47.16% |
| Change | -0.36 | -0.07 | - | +0.44 | +0.73 | +1.41 |
| Level | Major | Major | - | Major | Intermediate | Intermediate |
Pivot points can also be used to set your price objectives. Here is the price situation in relation to pivot points:
| Pivot points | S3 | S2 | S1 | PP | R1 | R2 | R3 |
|---|---|---|---|---|---|---|---|
| Standard | 2.77 | 2.80 | 2.82 | 2.85 | 2.87 | 2.90 | 2.92 |
| Camarilla | 2.84 | 2.84 | 2.85 | 2.85 | 2.86 | 2.86 | 2.86 |
| Woodie | 2.78 | 2.80 | 2.83 | 2.85 | 2.88 | 2.90 | 2.93 |
| Fibonacci | 2.80 | 2.82 | 2.83 | 2.85 | 2.87 | 2.88 | 2.90 |
| Pivot points | S3 | S2 | S1 | PP | R1 | R2 | R3 |
|---|---|---|---|---|---|---|---|
| Standard | 2.24 | 2.37 | 2.59 | 2.72 | 2.94 | 3.07 | 3.29 |
| Camarilla | 2.71 | 2.75 | 2.78 | 2.81 | 2.84 | 2.87 | 2.91 |
| Woodie | 2.29 | 2.39 | 2.64 | 2.74 | 2.99 | 3.09 | 3.34 |
| Fibonacci | 2.37 | 2.50 | 2.59 | 2.72 | 2.85 | 2.94 | 3.07 |
| Pivot points | S3 | S2 | S1 | PP | R1 | R2 | R3 |
|---|---|---|---|---|---|---|---|
| Standard | 1.73 | 2.13 | 2.36 | 2.76 | 2.99 | 3.39 | 3.62 |
| Camarilla | 2.42 | 2.48 | 2.53 | 2.59 | 2.65 | 2.71 | 2.76 |
| Woodie | 1.65 | 2.09 | 2.28 | 2.72 | 2.91 | 3.35 | 3.54 |
| Fibonacci | 2.13 | 2.37 | 2.52 | 2.76 | 3.00 | 3.15 | 3.39 |
Numerical data
The following are the details of the technical indicators and moving averages that were collected to generate this technical analysis:
| RSI (14): | 65.92 | |
| MACD (12,26,9): | -0.0300 | |
| Directional Movement: | 16.16 | |
| AROON (14): | 57.14 | |
| DEMA (21): | 2.66 | |
| Parabolic SAR (0,02-0,02-0,2): | 2.53 | |
| Elder Ray (13): | 0.20 | |
| Super Trend (3,10): | 2.66 | |
| Zig ZAG (10): | 3.00 | |
| VORTEX (21): | 0.9500 | |
| Stochastique (14,3,5): | 95.38 | |
| TEMA (21): | 2.74 | |
| Williams %R (14): | -0.88 | |
| Chande Momentum Oscillator (20): | 0.42 | |
| Repulse (5,40,3): | 9.1500 | |
| ROCnROLL: | 1 | |
| TRIX (15,9): | -0.4800 | |
| Courbe Coppock: | 6.87 |
| MA7: | 2.73 | |
| MA20: | 2.65 | |
| MA50: | 2.91 | |
| MA100: | 3.27 | |
| MAexp7: | 2.78 | |
| MAexp20: | 2.73 | |
| MAexp50: | 2.89 | |
| MAexp100: | 3.09 | |
| Price / MA7: | +9.52% | |
| Price / MA20: | +12.83% | |
| Price / MA50: | +2.75% | |
| Price / MA100: | -8.56% | |
| Price / MAexp7: | +7.55% | |
| Price / MAexp20: | +9.52% | |
| Price / MAexp50: | +3.46% | |
| Price / MAexp100: | -3.24% |
News
The latest news and videos published on SACHEM CAPITAL CORP. at the time of the analysis were as follows:
- Sachem Capital Corp. Announces Withdrawal of Public Debt Offering
- Sachem Capital Corp. Announces Full Repayment and Delisting of Maturing Unsecured Unsubordinated Notes from NYSE
- Sachem Capital Corp. Announces Registered Public Offering of Notes
- Sachem Capital Corp. Announces Appointment of Nicholas M. Marcello as Interim Chief Financial Officer
- Sachem Capital Reports First Quarter 2024 Results – Revenues Grew 17.0% to $17.2 Million
About author
Online


Add a comment
Comments
0 comments on the analysis SACHEM CAPITAL CORP. - Daily