SACHEM CAPITAL CORP. - Daily - Technical analysis published on 06/24/2024 (GMT)
- 147
- 0
Click here for a new analysis!
- Timeframe : Daily
- - Analysis generated on
- Status : TARGET REACHED

Summary of the analysis

Additional analysis
Quotes
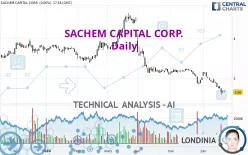
The SACHEM CAPITAL CORP. price is 2.65 USD. On the day, this instrument lost -0.38% and was traded between 2.64 USD and 2.70 USD over the period. The price is currently at +0.38% from its lowest and -1.85% from its highest.The Central Gaps scanner detects a bearish opening marking the presence of sellers ahead of buyers at the opening but not sufficiently marked to allow the price to register a quotation gap.
Bearish opening
Type : Bearish
Timeframe : Openning
Here is a more detailed summary of the historical variations registered by SACHEM CAPITAL CORP.:
Near a new LOW record (1 year)
Type : Bearish
Timeframe : Weekly
Near a new LOW record (1st january)
Type : Bearish
Timeframe : Weekly
Near a new LOW record (1 month)
Type : Bearish
Timeframe : Weekly
Technical
Technical analysis of this Daily chart of SACHEM CAPITAL CORP. indicates that the overall trend is strongly bearish. 92.86% of the signals given by moving averages are bearish. This strongly bearish trend is supported by the strong bearish signals given by short-term moving averages. The Central Indicators scanner does not detect any result on moving averages that would impact this trend.
An assessment of technical indicators does not currently provide any relevant information on the direction of future price movements.
Caution: the Central Indicators scanner currently detects an excess:
RSI indicator is oversold : under 30
Type : Neutral
Timeframe : Daily
CCI indicator is oversold : under -100
Type : Neutral
Timeframe : Daily
Williams %R indicator is oversold : under -80
Type : Neutral
Timeframe : Daily
The analysis of the price chart with Central Patterns scanners does not return any result.
There is also a Japanese candlestick pattern detected by Central Candlesticks that could mark the end of the current short-term trend:
Doji
Type : Neutral
Timeframe : Daily
| S1 | Price | R1 | R2 | R3 | |
|---|---|---|---|---|---|
| ProTrendLines | 2.63 | 2.65 | 2.92 | 3.15 | 3.43 |
| Change (%) | -0.75% | - | +10.19% | +18.87% | +29.43% |
| Change | -0.02 | - | +0.27 | +0.50 | +0.78 |
| Level | Intermediate | - | Intermediate | Intermediate | Intermediate |
Pivot points can also be used to set your price objectives. Here is the price situation in relation to pivot points:
| Pivot points | S3 | S2 | S1 | PP | R1 | R2 | R3 |
|---|---|---|---|---|---|---|---|
| Standard | 2.56 | 2.59 | 2.63 | 2.66 | 2.70 | 2.73 | 2.77 |
| Camarilla | 2.64 | 2.65 | 2.65 | 2.66 | 2.67 | 2.67 | 2.68 |
| Woodie | 2.56 | 2.59 | 2.63 | 2.66 | 2.70 | 2.73 | 2.77 |
| Fibonacci | 2.59 | 2.62 | 2.64 | 2.66 | 2.69 | 2.71 | 2.73 |
| Pivot points | S3 | S2 | S1 | PP | R1 | R2 | R3 |
|---|---|---|---|---|---|---|---|
| Standard | 2.33 | 2.45 | 2.56 | 2.68 | 2.79 | 2.91 | 3.02 |
| Camarilla | 2.60 | 2.62 | 2.64 | 2.66 | 2.68 | 2.70 | 2.72 |
| Woodie | 2.32 | 2.45 | 2.55 | 2.68 | 2.78 | 2.91 | 3.01 |
| Fibonacci | 2.45 | 2.54 | 2.60 | 2.68 | 2.77 | 2.83 | 2.91 |
| Pivot points | S3 | S2 | S1 | PP | R1 | R2 | R3 |
|---|---|---|---|---|---|---|---|
| Standard | 2.43 | 2.64 | 2.83 | 3.04 | 3.23 | 3.44 | 3.63 |
| Camarilla | 2.91 | 2.95 | 2.98 | 3.02 | 3.06 | 3.09 | 3.13 |
| Woodie | 2.42 | 2.64 | 2.82 | 3.04 | 3.22 | 3.44 | 3.62 |
| Fibonacci | 2.64 | 2.79 | 2.89 | 3.04 | 3.19 | 3.29 | 3.44 |
Numerical data
The following are the details of the technical indicators and moving averages that were collected to generate this technical analysis:
| RSI (14): | 24.08 | |
| MACD (12,26,9): | -0.1300 | |
| Directional Movement: | -29.97 | |
| AROON (14): | -85.71 | |
| DEMA (21): | 2.72 | |
| Parabolic SAR (0,02-0,02-0,2): | 3.02 | |
| Elder Ray (13): | -0.14 | |
| Super Trend (3,10): | 2.91 | |
| Zig ZAG (10): | 2.65 | |
| VORTEX (21): | 0.6900 | |
| Stochastique (14,3,5): | 12.70 | |
| TEMA (21): | 2.68 | |
| Williams %R (14): | -88.79 | |
| Chande Momentum Oscillator (20): | -0.41 | |
| Repulse (5,40,3): | -5.0200 | |
| ROCnROLL: | 2 | |
| TRIX (15,9): | -0.4600 | |
| Courbe Coppock: | 19.50 |
| MA7: | 2.74 | |
| MA20: | 2.90 | |
| MA50: | 3.07 | |
| MA100: | 3.39 | |
| MAexp7: | 2.73 | |
| MAexp20: | 2.88 | |
| MAexp50: | 3.08 | |
| MAexp100: | 3.25 | |
| Price / MA7: | -3.28% | |
| Price / MA20: | -8.62% | |
| Price / MA50: | -13.68% | |
| Price / MA100: | -21.83% | |
| Price / MAexp7: | -2.93% | |
| Price / MAexp20: | -7.99% | |
| Price / MAexp50: | -13.96% | |
| Price / MAexp100: | -18.46% |
News
The latest news and videos published on SACHEM CAPITAL CORP. at the time of the analysis were as follows:
- Sachem Capital Corp. Announces Full Repayment and Delisting of Maturing Unsecured Unsubordinated Notes from NYSE
- Sachem Capital Corp. Announces Registered Public Offering of Notes
- Sachem Capital Corp. Announces Appointment of Nicholas M. Marcello as Interim Chief Financial Officer
- Sachem Capital Reports First Quarter 2024 Results – Revenues Grew 17.0% to $17.2 Million
- Sachem Capital Sets Dates for First Quarter 2024 Earnings Release and Conference Call
About author
Online


Add a comment
Comments
0 comments on the analysis SACHEM CAPITAL CORP. - Daily