SACHEM CAPITAL CORP. overview
SACHEM CAPITAL CORP.
> Analyses
Thank you
Reply
Chart
Londinia
has published a new analysis.
- 0
- 75534
- 15128
- 0
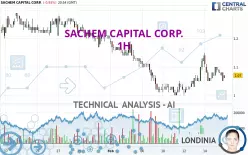
Timeframe : 1H - Simple chart
Status : NEUTRAL
A slightly bearish trend and a neutral short term. With such a pattern, it is difficult to favour buying or selling. The first support is located at 3.15 USD. The first resistance is located at 3.25
SACHEM CAPITAL CORP.
> Analyses
Thank you
Reply
Chart
Londinia
has published a new analysis.
- 0
- 75534
- 15128
- 0
Timeframe : Daily - Simple chart
Status : IN PROGRESS...
The bearish trend is currently very strong for SACHEM CAPITAL CORP.. As long as the price remains below the resistance at , you could try to take advantage of the bearish rally. The first bearish
SACHEM CAPITAL CORP.
> Analyses
Thank you
Reply
Chart
Londinia
has published a new analysis.
- 0
- 75534
- 15128
- 0
Timeframe : Daily - Simple chart
Status : LEVEL MAINTAINED
The bearish trend is currently very strong for SACHEM CAPITAL CORP.. As long as the price remains below the resistance at 3.30 USD, you could try to take advantage of the bearish rally. The first
Statistics
- Analyses : 14
- Followers : 0