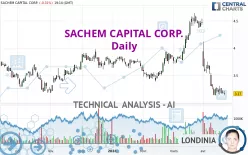
SACHEM CAPITAL CORP. - Daily - Technical analysis published on 04/19/2024 (GMT)
- 135
- 0
Click here for a new analysis!
- Timeframe : Daily
- - Analysis generated on
- Status : LEVEL MAINTAINED

Summary of the analysis

Additional analysis
Quotes
The SACHEM CAPITAL CORP. price is 3.17 USD. The price registered a decrease of -0.31% on the session and was traded between 3.14 USD and 3.21 USD over the period. The price is currently at +0.96% from its lowest and -1.25% from its highest.So that you have an overall view of the price change, here is a table showing the variations over several periods:
Near a new LOW record (1st january)
Type : Bearish
Timeframe : Weekly
New LOW record (1 month)
Type : Bearish
Timeframe : Weekly
Technical
A technical analysis in Daily of this SACHEM CAPITAL CORP. chart shows a sharp bearish trend. The signals given by moving averages are 85.71% bearish. This strong bearish trend is confirmed by the strong signals currently being given by short-term moving averages. The Central Indicators market scanner currently does not detect any result that concerns moving averages.
In fact, 12 technical indicators on 18 studied are currently positioned bearish. But beware of excesses. The Central Indicators scanner currently detects this:
RSI indicator is oversold : under 30
Type : Neutral
Timeframe : Daily
Williams %R indicator is oversold : under -80
Type : Neutral
Timeframe : Daily
Pivot points : price is under support 1
Type : Neutral
Timeframe : Daily
Central Patterns, the market scanner focusing on chart patterns, resistances and supports found this result:
Near support of channel
Type : Bullish
Timeframe : Daily
The Central Candlesticks scanner, specialised in Japanese candlesticks, did not identify any signals.
| S3 | S2 | S1 | Price | R1 | R2 | R3 | |
|---|---|---|---|---|---|---|---|
| ProTrendLines | 2.63 | 2.92 | 3.15 | 3.17 | 3.30 | 3.43 | 3.57 |
| Change (%) | -17.03% | -7.89% | -0.63% | - | +4.10% | +8.20% | +12.62% |
| Change | -0.54 | -0.25 | -0.02 | - | +0.13 | +0.26 | +0.40 |
| Level | Intermediate | Intermediate | Intermediate | - | Major | Intermediate | Intermediate |
Attention could also be paid to pivot points to set price objectives:
| Pivot points | S3 | S2 | S1 | PP | R1 | R2 | R3 |
|---|---|---|---|---|---|---|---|
| Standard | 3.10 | 3.13 | 3.16 | 3.19 | 3.22 | 3.25 | 3.28 |
| Camarilla | 3.16 | 3.17 | 3.18 | 3.18 | 3.19 | 3.19 | 3.20 |
| Woodie | 3.09 | 3.13 | 3.15 | 3.19 | 3.21 | 3.25 | 3.27 |
| Fibonacci | 3.13 | 3.16 | 3.17 | 3.19 | 3.22 | 3.23 | 3.25 |
| Pivot points | S3 | S2 | S1 | PP | R1 | R2 | R3 |
|---|---|---|---|---|---|---|---|
| Standard | 2.64 | 2.89 | 3.05 | 3.30 | 3.46 | 3.71 | 3.87 |
| Camarilla | 3.10 | 3.14 | 3.17 | 3.21 | 3.25 | 3.29 | 3.32 |
| Woodie | 2.60 | 2.87 | 3.01 | 3.28 | 3.42 | 3.69 | 3.83 |
| Fibonacci | 2.89 | 3.05 | 3.14 | 3.30 | 3.46 | 3.55 | 3.71 |
| Pivot points | S3 | S2 | S1 | PP | R1 | R2 | R3 |
|---|---|---|---|---|---|---|---|
| Standard | 2.88 | 3.24 | 3.78 | 4.14 | 4.68 | 5.04 | 5.58 |
| Camarilla | 4.07 | 4.16 | 4.24 | 4.32 | 4.40 | 4.49 | 4.57 |
| Woodie | 2.97 | 3.29 | 3.87 | 4.19 | 4.77 | 5.09 | 5.67 |
| Fibonacci | 3.24 | 3.58 | 3.80 | 4.14 | 4.48 | 4.70 | 5.04 |
Numerical data
The following are the details of the technical indicators and moving averages that were collected to generate this technical analysis:
| RSI (14): | 29.55 | |
| MACD (12,26,9): | -0.2000 | |
| Directional Movement: | -15.99 | |
| AROON (14): | -50.00 | |
| DEMA (21): | 3.22 | |
| Parabolic SAR (0,02-0,02-0,2): | 3.38 | |
| Elder Ray (13): | -0.16 | |
| Super Trend (3,10): | 3.59 | |
| Zig ZAG (10): | 3.14 | |
| VORTEX (21): | 0.7300 | |
| Stochastique (14,3,5): | 2.63 | |
| TEMA (21): | 3.04 | |
| Williams %R (14): | -100.00 | |
| Chande Momentum Oscillator (20): | -0.40 | |
| Repulse (5,40,3): | -5.5600 | |
| ROCnROLL: | 2 | |
| TRIX (15,9): | -0.5900 | |
| Courbe Coppock: | 39.16 |
| MA7: | 3.20 | |
| MA20: | 3.57 | |
| MA50: | 3.68 | |
| MA100: | 3.63 | |
| MAexp7: | 3.22 | |
| MAexp20: | 3.45 | |
| MAexp50: | 3.60 | |
| MAexp100: | 3.57 | |
| Price / MA7: | -0.94% | |
| Price / MA20: | -11.20% | |
| Price / MA50: | -13.86% | |
| Price / MA100: | -12.67% | |
| Price / MAexp7: | -1.55% | |
| Price / MAexp20: | -8.12% | |
| Price / MAexp50: | -11.94% | |
| Price / MAexp100: | -11.20% |
News
The latest news and videos published on SACHEM CAPITAL CORP. at the time of the analysis were as follows:
- Sachem Capital Reports Full Year 2023 Results
- Sachem Capital Corp. Announces Dividend of $0.11 Per Share
- Sachem Capital Sets Dates for 2023 Earnings Release and Conference Call
- Sachem Capital Corp. Announces Tax Reporting Information
- Sachem Capital Corp. Announces Dividend of $0.11 per Share
About author
Online


Add a comment
Comments
0 comments on the analysis SACHEM CAPITAL CORP. - Daily