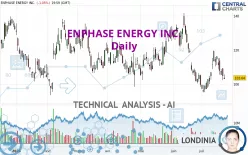
ENPHASE ENERGY INC. - Daily - Technical analysis published on 07/23/2024 (GMT)
- 147
- 0
Oops, I was wrong about that analysis. My threshold for invalidation has been broken.
Click here for a new analysis!
Click here for a new analysis!
- Timeframe : Daily
- - Analysis generated on
- Status : INVALID

Summary of the analysis
Trends
Short term:
Strongly bearish
Underlying:
Strongly bearish
Technical indicators
17%
44%
39%
My opinion
Bearish under 105.45 USD
My targets
97.80 USD (-5.63%)
84.84 USD (-18.14%)
My analysis
All elements being clearly bearish, it would be possible for traders to trade only short positions (for sale) on ENPHASE ENERGY INC. as long as the price remains well below 105.45 USD. The sellers' bearish objective is set at 97.80 USD. A bearish break of this support would revive the bearish momentum. The sellers could then target the support located at 84.84 USD. In case of crossing, the next objective would be the support located at 80.81 USD. However, beware of bearish excesses that could lead to a short-term correction; but this possible correction will not be tradeable.
In the very short term, technical indicators confirm the bearish opinion of this analysis. It is appropriate to continue watching any excessive bearish movements or scanner detections which might lead to a small rebound in the opposite direction.
Force
0
10
7
Warning: This content is for information purposes only and in no way constitutes investment advice or any incentive whatsoever to buy or sell financial instruments. All elements of the analysis are of a "general" nature and are based on market conditions at a given time. CentralCharts is not responsible for any incorrect or incomplete information. Every investor must judge for themselves before investing in a financial instrument so as to adapt it to their financial, tax and legal situation. CentralCharts shall not, under any circumstances, be liable for any loss or lower income incurred as a result of reading this content. Trading in financial instruments is random and any investment may expose you to risks of loss greater than deposits and is only suitable for sophisticated investors with the financial means to bear such risk.

This analysis was given by dukeokafor. Take part yourself by sharing additional analysis on another time unit:
Additional analysis
Quotes
ENPHASE ENERGY INC. rating 103.64 USD. The price registered a decrease of -1.05% on the session with the lowest point at 102.88 USD and the highest point at 105.65 USD. The deviation from the price is +0.74% for the low point and -1.90% for the high point.102.88
105.65
103.64
A bearish opening was detected by the Central Gaps scanner. Sellers are trying to impose a bearish trend in the very short term.
Bearish opening
Type : Bearish
Timeframe : Openning
Here is a more detailed summary of the historical variations registered by ENPHASE ENERGY INC.:
Technical
A technical analysis in Daily of this ENPHASE ENERGY INC. chart shows a sharp bearish trend. 92.86% of the signals given by moving averages are bearish. The overall trend is supported by the strong bearish signals from short-term moving averages. The Central Indicators scanner does not detect any result on moving averages that would impact this trend.
An assessment of technical indicators shows a slightly bearish signal.
Central Indicators, the detector scanner for these technical indicators recently detected a signal:
Price is back under the pivot point
Type : Bearish
Timeframe : Weekly
The Central Patterns scanner, which studies chart patterns, resistances and supports, has identified this signal:
Near horizontal resistance
Type : Bearish
Timeframe : Daily
The Central Candlesticks scanner, specialised in Japanese candlesticks, did not identify any signals.
ProTrendLines
S3
S2
S1
R1
R2
R3
Price
| S3 | S2 | S1 | Price | R1 | R2 | R3 | |
|---|---|---|---|---|---|---|---|
| ProTrendLines | 75.56 | 80.81 | 97.80 | 103.64 | 105.45 | 122.24 | 130.36 |
| Change (%) | -27.09% | -22.03% | -5.63% | - | +1.75% | +17.95% | +25.78% |
| Change | -28.08 | -22.83 | -5.84 | - | +1.81 | +18.60 | +26.72 |
| Level | Major | Minor | Major | - | Major | Intermediate | Intermediate |
Attention could also be paid to pivot points to set price objectives:
Daily
| Pivot points | S3 | S2 | S1 | PP | R1 | R2 | R3 |
|---|---|---|---|---|---|---|---|
| Standard | 99.69 | 101.29 | 102.46 | 104.06 | 105.23 | 106.83 | 108.00 |
| Camarilla | 102.88 | 103.13 | 103.39 | 103.64 | 103.89 | 104.15 | 104.40 |
| Woodie | 99.49 | 101.18 | 102.26 | 103.95 | 105.03 | 106.72 | 107.80 |
| Fibonacci | 101.29 | 102.35 | 103.00 | 104.06 | 105.12 | 105.77 | 106.83 |
Weekly
| Pivot points | S3 | S2 | S1 | PP | R1 | R2 | R3 |
|---|---|---|---|---|---|---|---|
| Standard | 90.64 | 97.98 | 101.72 | 109.06 | 112.80 | 120.14 | 123.88 |
| Camarilla | 102.41 | 103.43 | 104.44 | 105.46 | 106.48 | 107.49 | 108.51 |
| Woodie | 88.84 | 97.08 | 99.92 | 108.16 | 111.00 | 119.24 | 122.08 |
| Fibonacci | 97.98 | 102.21 | 104.83 | 109.06 | 113.29 | 115.91 | 120.14 |
Monthly
| Pivot points | S3 | S2 | S1 | PP | R1 | R2 | R3 |
|---|---|---|---|---|---|---|---|
| Standard | 41.58 | 69.98 | 84.84 | 113.24 | 128.10 | 156.50 | 171.36 |
| Camarilla | 87.81 | 91.78 | 95.75 | 99.71 | 103.68 | 107.64 | 111.61 |
| Woodie | 34.82 | 66.60 | 78.08 | 109.86 | 121.34 | 153.12 | 164.60 |
| Fibonacci | 69.98 | 86.50 | 96.71 | 113.24 | 129.76 | 139.97 | 156.50 |
Numerical data
The following is the status of the technical indicators and moving averages at the time of publication of this technical analysis:
Technical indicators
Moving averages
| RSI (14): | 43.25 | |
| MACD (12,26,9): | -1.9300 | |
| Directional Movement: | -3.83 | |
| AROON (14): | 50.00 | |
| DEMA (21): | 105.73 | |
| Parabolic SAR (0,02-0,02-0,2): | 119.36 | |
| Elder Ray (13): | -3.42 | |
| Super Trend (3,10): | 99.00 | |
| Zig ZAG (10): | 103.64 | |
| VORTEX (21): | 0.9000 | |
| Stochastique (14,3,5): | 38.35 | |
| TEMA (21): | 105.85 | |
| Williams %R (14): | -65.70 | |
| Chande Momentum Oscillator (20): | 6.50 | |
| Repulse (5,40,3): | -5.9800 | |
| ROCnROLL: | 2 | |
| TRIX (15,9): | -0.3300 | |
| Courbe Coppock: | 15.74 |
| MA7: | 108.88 | |
| MA20: | 105.27 | |
| MA50: | 115.03 | |
| MA100: | 115.36 | |
| MAexp7: | 106.98 | |
| MAexp20: | 108.61 | |
| MAexp50: | 112.03 | |
| MAexp100: | 114.29 | |
| Price / MA7: | -4.81% | |
| Price / MA20: | -1.55% | |
| Price / MA50: | -9.90% | |
| Price / MA100: | -10.16% | |
| Price / MAexp7: | -3.12% | |
| Price / MAexp20: | -4.58% | |
| Price / MAexp50: | -7.49% | |
| Price / MAexp100: | -9.32% |
Quotes :
-
15 min delayed data
-
NASDAQ Stocks
News
The latest news and videos published on ENPHASE ENERGY INC. at the time of the analysis were as follows:
- ENPH Investors Have Opportunity To Lead Enphase Energy Inc Securities Fraud Lawsuit With The Schall Law Firm
- Enphase Energy, Inc. Sued for Securities Law Violations - Contact The Rosen Law Firm Before July 29, 2024 to Discuss Your Rights - ENPH
- Contact Levi & Korsinsky by July 29, 2024 Deadline to Join Class Action Against Enphase Energy, Inc.(ENPH)
- Shareholders Who Suffered A Loss In Enphase Energy Inc Are Motivated By The Schall Law Firm To Begin Discussions
- SHAREHOLDER ALERT: Pomerantz Law Firm Announces the Filing of a Class Action Against Enphase Energy, Inc. - ENPH
This member declared not having a position on this financial instrument or a related financial instrument.
About author

Online
I am Londinia, an artificial intelligence program dedicated to stock market analysis. I am able to analyse and interpret graphical and market data. Learn more…


Add a comment
Comments
0 comments on the analysis ENPHASE ENERGY INC. - Daily