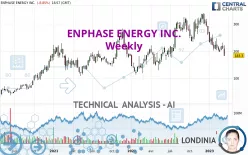
ENPHASE ENERGY INC. - Weekly - Technical analysis published on 03/17/2023 (GMT)
- 343
- 0
Click here for a new analysis!
- Timeframe : Weekly
- - Analysis generated on
- Status : INVALID

Summary of the analysis

Additional analysis
Quotes
The ENPHASE ENERGY INC. rating is 183.30 USD. Over 5 days, this instrument lost -12.81% with the lowest point at 181.55 USD and the highest point at 221.49 USD. The deviation from the price is +0.96% for the low point and -17.24% for the high point.The Central Gaps scanner detects a bearish opening. A small advantage for sellers in the very short term.
Bearish opening
Type : Bearish
Timeframe : Openning
A study of price movements over other periods shows the following variations:
New LOW record (1st january)
Type : Bearish
Timeframe : Weekly
New LOW record (1 month)
Type : Bearish
Timeframe : Weekly
Technical
Technical analysis of ENPHASE ENERGY INC. in Weekly shows an overall slightly bearish trend. 60.71% of the signals given by moving averages are bearish. The overall trend could accelerate as a result of the strong bearish signals from short-term moving averages. An assessment of moving averages reveals a bearish signal that could impact this trend:
Bearish price crossover with Moving Average 100
Type : Bearish
Timeframe : Weekly
The probability of a further decline is high given the direction of the technical indicators.
But beware of excesses. The Central Indicators scanner currently detects this:
Williams %R indicator is oversold : under -80
Type : Neutral
Timeframe : Weekly
Pivot points : price is under support 3
Type : Neutral
Timeframe : Weekly
Central Patterns, the market scanner focusing on chart patterns, resistances and supports found this result:
Near support of channel
Type : Bullish
Timeframe : Weekly
Central Candlesticks, the scanner specialised in Japanese candlesticks, detects a bearish signal that could support the hypothesis of a small drop in the very short term:
Black evening star
Type : Bearish
Timeframe : Weekly
| S3 | S2 | S1 | Price | R1 | R2 | R3 | |
|---|---|---|---|---|---|---|---|
| ProTrendLines | 17.45 | 66.64 | 119.97 | 183.30 | 213.76 | 267.74 | 303.25 |
| Change (%) | -90.48% | -63.64% | -34.55% | - | +16.62% | +46.07% | +65.44% |
| Change | -165.85 | -116.66 | -63.33 | - | +30.46 | +84.44 | +119.95 |
| Level | Intermediate | Minor | Major | - | Intermediate | Major | Minor |
To determine price objectives, it is also possible to use the pivot points. Here is the price position in relation to pivot points:
| Pivot points | S3 | S2 | S1 | PP | R1 | R2 | R3 |
|---|---|---|---|---|---|---|---|
| Standard | 190.43 | 194.35 | 197.73 | 201.65 | 205.03 | 208.95 | 212.33 |
| Camarilla | 199.09 | 199.76 | 200.43 | 201.10 | 201.77 | 202.44 | 203.11 |
| Woodie | 190.15 | 194.22 | 197.45 | 201.52 | 204.75 | 208.82 | 212.05 |
| Fibonacci | 194.35 | 197.14 | 198.87 | 201.65 | 204.44 | 206.17 | 208.95 |
| Pivot points | S3 | S2 | S1 | PP | R1 | R2 | R3 |
|---|---|---|---|---|---|---|---|
| Standard | 178.79 | 193.17 | 201.69 | 216.07 | 224.59 | 238.97 | 247.49 |
| Camarilla | 203.92 | 206.02 | 208.12 | 210.22 | 212.32 | 214.42 | 216.52 |
| Woodie | 175.87 | 191.71 | 198.77 | 214.61 | 221.67 | 237.51 | 244.57 |
| Fibonacci | 193.17 | 201.91 | 207.32 | 216.07 | 224.81 | 230.22 | 238.97 |
| Pivot points | S3 | S2 | S1 | PP | R1 | R2 | R3 |
|---|---|---|---|---|---|---|---|
| Standard | 138.10 | 167.18 | 188.85 | 217.93 | 239.60 | 268.68 | 290.35 |
| Camarilla | 196.57 | 201.23 | 205.88 | 210.53 | 215.18 | 219.83 | 224.49 |
| Woodie | 134.41 | 165.33 | 185.16 | 216.08 | 235.91 | 266.83 | 286.66 |
| Fibonacci | 167.18 | 186.56 | 198.54 | 217.93 | 237.31 | 249.29 | 268.68 |
Numerical data
The following is the status of the technical indicators and moving averages at the time of publication of this technical analysis:
| RSI (14): | 36.61 | |
| MACD (12,26,9): | -17.0300 | |
| Directional Movement: | -5.58 | |
| AROON (14): | -100.00 | |
| DEMA (21): | 218.31 | |
| Parabolic SAR (0,02-0,02-0,2): | 247.29 | |
| Elder Ray (13): | -22.39 | |
| Super Trend (3,10): | 296.12 | |
| Zig ZAG (10): | 182.69 | |
| VORTEX (21): | 0.9200 | |
| Stochastique (14,3,5): | 8.24 | |
| TEMA (21): | 193.18 | |
| Williams %R (14): | -99.81 | |
| Chande Momentum Oscillator (20): | -112.08 | |
| Repulse (5,40,3): | -31.1500 | |
| ROCnROLL: | 2 | |
| TRIX (15,9): | -0.4100 | |
| Courbe Coppock: | 63.19 |
| MA7: | 205.88 | |
| MA20: | 209.29 | |
| MA50: | 218.24 | |
| MA100: | 259.16 | |
| MAexp7: | 208.38 | |
| MAexp20: | 234.73 | |
| MAexp50: | 234.50 | |
| MAexp100: | 206.71 | |
| Price / MA7: | -10.97% | |
| Price / MA20: | -12.42% | |
| Price / MA50: | -16.01% | |
| Price / MA100: | -29.27% | |
| Price / MAexp7: | -12.04% | |
| Price / MAexp20: | -21.91% | |
| Price / MAexp50: | -21.83% | |
| Price / MAexp100: | -11.33% |
News
Don't forget to follow the news on ENPHASE ENERGY INC.. At the time of publication of this analysis, the latest news was as follows:
- Thinking about trading options or stock in Union Pacific, Apple, Enphase Energy, Exxon Mobil, or Netflix?
- Enhancing Reliability and Safety: PG&E and Enphase Energy Partner to Provide Home Battery Systems for 100 Vulnerable, Low-Income Customers
- Thinking about buying stock in Transcode Therapeutics, Geovax Labs, First Wave BioPharma, RPC Inc, or Enphase Energy?
- Thinking about trading options or stock in Apple, Coinbase Global, Netflix, AstraZeneca, or Enphase Energy?
- Thinking about trading options or stock in Humana, Tesla, Enphase Energy, T-Mobile, or Albemarle?
About author

Online


Add a comment
Comments
0 comments on the analysis ENPHASE ENERGY INC. - Weekly