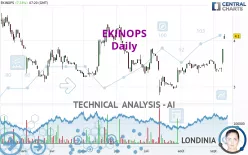
EKINOPS - Daily - Technical analysis published on 09/11/2024 (GMT)
- 153
- 0
Click here for a new analysis!
- Timeframe : Daily
- - Analysis generated on
- Status : INVALID

Summary of the analysis

Additional analysis
Quotes
EKINOPS rating 4.100 EUR. The price has increased by +7.33% since the last closing with the lowest point at 4.040 EUR and the highest point at 4.145 EUR. The deviation from the price is +1.49% for the low point and -1.09% for the high point.A bullish gap was detected at the opening by the Central Gaps scanner. There are a lot of buyers and they have the upper hand in the very short term.
Opening Gap UP
Type : Bullish
Timeframe : Openning
So that you have an overall view of the price change, here is a table showing the variations over several periods:
New HIGH record (1 month)
Type : Bullish
Timeframe : Weekly
Technical
Technical analysis of this Daily chart of EKINOPS indicates that the overall trend is bullish. 78.57% of the signals given by moving averages are bullish. This bullish trend is supported by the strong bullish signals given by short-term moving averages. The Central Indicators market scanner is currently detecting several bullish signals that could impact this trend:
Bullish trend reversal : Moving Average 100
Type : Bullish
Timeframe : Daily
Bullish trend reversal : adaptative moving average 20
Type : Bullish
Timeframe : Daily
Bullish trend reversal : adaptative moving average 50
Type : Bullish
Timeframe : Daily
Bullish trend reversal : adaptative moving average 100
Type : Bullish
Timeframe : Daily
Moving Average bullish crossovers : AMA20 & AMA50
Type : Bullish
Timeframe : Daily
In fact, 15 technical indicators on 18 studied are currently bullish. Caution: the Central Indicators scanner currently detects an excess:
RSI indicator is overbought : over 70
Type : Neutral
Timeframe : Daily
CCI indicator is overbought : over 100
Type : Neutral
Timeframe : Daily
Williams %R indicator is overbought : over -20
Type : Neutral
Timeframe : Daily
Pivot points : price is over resistance 2
Type : Neutral
Timeframe : Daily
Pivot points : price is over resistance 3
Type : Neutral
Timeframe : Weekly
The Central Patterns scanner, which studies chart patterns, resistances and supports, has identified these signals:
Near horizontal resistance
Type : Bearish
Timeframe : Daily
Near resistance of channel
Type : Bearish
Timeframe : Daily
Near resistance of triangle
Type : Bearish
Timeframe : Daily
The presence of a bullish Japanese candlestick pattern detected by Central Candlesticks that could cause a very short term rebound was also detected:
Upside gap
Type : Bullish
Timeframe : Daily
| S3 | S2 | S1 | Price | R1 | R2 | R3 | |
|---|---|---|---|---|---|---|---|
| ProTrendLines | 3.179 | 3.573 | 3.840 | 4.100 | 4.286 | 5.020 | 5.300 |
| Change (%) | -22.46% | -12.85% | -6.34% | - | +4.54% | +22.44% | +29.27% |
| Change | -0.921 | -0.527 | -0.260 | - | +0.186 | +0.920 | +1.200 |
| Level | Major | Intermediate | Major | - | Major | Minor | Minor |
Attention could also be paid to pivot points to set price objectives:
| Pivot points | S3 | S2 | S1 | PP | R1 | R2 | R3 |
|---|---|---|---|---|---|---|---|
| Standard | 3.270 | 3.380 | 3.600 | 3.710 | 3.930 | 4.040 | 4.260 |
| Camarilla | 3.729 | 3.760 | 3.790 | 3.820 | 3.850 | 3.881 | 3.911 |
| Woodie | 3.325 | 3.408 | 3.655 | 3.738 | 3.985 | 4.068 | 4.315 |
| Fibonacci | 3.380 | 3.506 | 3.584 | 3.710 | 3.836 | 3.914 | 4.040 |
| Pivot points | S3 | S2 | S1 | PP | R1 | R2 | R3 |
|---|---|---|---|---|---|---|---|
| Standard | 3.075 | 3.200 | 3.300 | 3.425 | 3.525 | 3.650 | 3.750 |
| Camarilla | 3.338 | 3.359 | 3.379 | 3.400 | 3.421 | 3.441 | 3.462 |
| Woodie | 3.063 | 3.194 | 3.288 | 3.419 | 3.513 | 3.644 | 3.738 |
| Fibonacci | 3.200 | 3.286 | 3.339 | 3.425 | 3.511 | 3.564 | 3.650 |
| Pivot points | S3 | S2 | S1 | PP | R1 | R2 | R3 |
|---|---|---|---|---|---|---|---|
| Standard | 3.017 | 3.143 | 3.347 | 3.473 | 3.677 | 3.803 | 4.007 |
| Camarilla | 3.459 | 3.490 | 3.520 | 3.550 | 3.580 | 3.611 | 3.641 |
| Woodie | 3.055 | 3.163 | 3.385 | 3.493 | 3.715 | 3.823 | 4.045 |
| Fibonacci | 3.143 | 3.269 | 3.347 | 3.473 | 3.599 | 3.677 | 3.803 |
Numerical data
The following is the status of the technical indicators and moving averages at the time of publication of this technical analysis:
| RSI (14): | 78.18 | |
| MACD (12,26,9): | 0.0830 | |
| Directional Movement: | 35.623 | |
| AROON (14): | 35.714 | |
| DEMA (21): | 3.622 | |
| Parabolic SAR (0,02-0,02-0,2): | 3.325 | |
| Elder Ray (13): | 0.515 | |
| Super Trend (3,10): | 3.710 | |
| Zig ZAG (10): | 4.100 | |
| VORTEX (21): | 1.1390 | |
| Stochastique (14,3,5): | 75.14 | |
| TEMA (21): | 3.693 | |
| Williams %R (14): | -5.49 | |
| Chande Momentum Oscillator (20): | 0.610 | |
| Repulse (5,40,3): | 9.0300 | |
| ROCnROLL: | 1 | |
| TRIX (15,9): | 0.1800 | |
| Courbe Coppock: | 8.60 |
| MA7: | 3.551 | |
| MA20: | 3.507 | |
| MA50: | 3.392 | |
| MA100: | 3.522 | |
| MAexp7: | 3.666 | |
| MAexp20: | 3.530 | |
| MAexp50: | 3.479 | |
| MAexp100: | 3.577 | |
| Price / MA7: | +15.46% | |
| Price / MA20: | +16.91% | |
| Price / MA50: | +20.87% | |
| Price / MA100: | +16.41% | |
| Price / MAexp7: | +11.84% | |
| Price / MAexp20: | +16.15% | |
| Price / MAexp50: | +17.85% | |
| Price / MAexp100: | +14.62% |
News
Don't forget to follow the news on EKINOPS. At the time of publication of this analysis, the latest news was as follows:
- Ekinops: Reactivation of the share buyback program
- Ekinops H1 2024 results: EBITDA margin of 14.3%
- Ekinops H1 2024 revenue: 57.5 m€
- Orange Business launches its SD-WAN Essentials solution based on Ekinops' technology
- Ekinops acquires 120,914 of its own shares from a historical shareholder
About author

Online


Add a comment
Comments
0 comments on the analysis EKINOPS - Daily