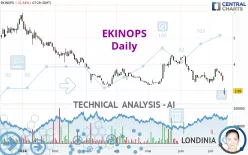
EKINOPS - Daily - Technical analysis published on 07/12/2024 (GMT)
- 169
- 0
- Who voted?
Click here for a new analysis!
- Timeframe : Daily
- - Analysis generated on
- Status : INVALID

Summary of the analysis

Additional analysis
Quotes
The EKINOPS rating is 2.990 EUR. The price is lower by -11.54% since the last closing with the lowest point at 2.820 EUR and the highest point at 3.095 EUR. The deviation from the price is +6.03% for the low point and -3.39% for the high point.The Central Gaps scanner detects the formation of a bearish gap marking the strong presence of sellers ahead of buyers at the opening. This formed a quotation gap.
Opening Gap DOWN
Type : Bearish
Timeframe : Openning
A study of price movements over other periods shows the following variations:
New LOW record (5 years)
Type : Bearish
Timeframe : Weekly
New LOW record (1 year)
Type : Bearish
Timeframe : Weekly
New LOW record (1st january)
Type : Bearish
Timeframe : Weekly
New LOW record (1 month)
Type : Bearish
Timeframe : Weekly
Technical
A technical analysis in Daily of this EKINOPS chart shows a sharp bearish trend. 89.29% of the signals given by moving averages are bearish. This strongly bearish trend is supported by the strong bearish signals given by short-term moving averages. The Central Indicators market scanner currently does not detect any result that concerns moving averages.
Technical indicators are bearish. There is still some doubt about the decline in the price.
Caution: the Central Indicators scanner currently detects an excess:
CCI indicator is oversold : under -100
Type : Neutral
Timeframe : Daily
Williams %R indicator is oversold : under -80
Type : Neutral
Timeframe : Daily
Pivot points : price is under support 3
Type : Neutral
Timeframe : Daily
Pivot points : price is under support 3
Type : Neutral
Timeframe : Weekly
MACD crosses DOWN its Moving Average
Type : Bearish
Timeframe : Daily
SuperTrend indicator bearish reversal
Type : Bearish
Timeframe : Daily
Central Patterns, the market scanner focusing on chart patterns, resistances and supports found these results:
Near support of channel
Type : Bullish
Timeframe : Daily
Near support of triangle
Type : Bullish
Timeframe : Daily
The Central Candlesticks scanner, specialised in Japanese candlesticks, did not identify any signals.
| S1 | Price | R1 | R2 | R3 | |
|---|---|---|---|---|---|
| ProTrendLines | 2.365 | 2.990 | 3.195 | 3.468 | 3.810 |
| Change (%) | -20.90% | - | +6.86% | +15.99% | +27.42% |
| Change | -0.625 | - | +0.205 | +0.478 | +0.820 |
| Level | Intermediate | - | Intermediate | Intermediate | Minor |
To determine price objectives, it is also possible to use the pivot points. Here is the price position in relation to pivot points:
| Pivot points | S3 | S2 | S1 | PP | R1 | R2 | R3 |
|---|---|---|---|---|---|---|---|
| Standard | 3.090 | 3.220 | 3.300 | 3.430 | 3.510 | 3.640 | 3.720 |
| Camarilla | 3.322 | 3.342 | 3.361 | 3.380 | 3.399 | 3.419 | 3.438 |
| Woodie | 3.065 | 3.208 | 3.275 | 3.418 | 3.485 | 3.628 | 3.695 |
| Fibonacci | 3.220 | 3.300 | 3.350 | 3.430 | 3.510 | 3.560 | 3.640 |
| Pivot points | S3 | S2 | S1 | PP | R1 | R2 | R3 |
|---|---|---|---|---|---|---|---|
| Standard | 2.873 | 3.087 | 3.413 | 3.627 | 3.953 | 4.167 | 4.493 |
| Camarilla | 3.592 | 3.641 | 3.691 | 3.740 | 3.790 | 3.839 | 3.889 |
| Woodie | 2.930 | 3.115 | 3.470 | 3.655 | 4.010 | 4.195 | 4.550 |
| Fibonacci | 3.087 | 3.293 | 3.420 | 3.627 | 3.833 | 3.960 | 4.167 |
| Pivot points | S3 | S2 | S1 | PP | R1 | R2 | R3 |
|---|---|---|---|---|---|---|---|
| Standard | 1.883 | 2.587 | 2.938 | 3.642 | 3.993 | 4.697 | 5.048 |
| Camarilla | 3.000 | 3.097 | 3.193 | 3.290 | 3.387 | 3.483 | 3.580 |
| Woodie | 1.708 | 2.499 | 2.763 | 3.554 | 3.818 | 4.609 | 4.873 |
| Fibonacci | 2.587 | 2.990 | 3.239 | 3.642 | 4.045 | 4.294 | 4.697 |
Numerical data
The following is the status of the technical indicators and moving averages at the time of publication of this technical analysis:
| RSI (14): | 31.28 | |
| MACD (12,26,9): | -0.0850 | |
| Directional Movement: | -30.724 | |
| AROON (14): | -35.714 | |
| DEMA (21): | 3.430 | |
| Parabolic SAR (0,02-0,02-0,2): | 3.830 | |
| Elder Ray (13): | -0.528 | |
| Super Trend (3,10): | 3.495 | |
| Zig ZAG (10): | 2.995 | |
| VORTEX (21): | 0.8610 | |
| Stochastique (14,3,5): | 27.54 | |
| TEMA (21): | 3.374 | |
| Williams %R (14): | -82.84 | |
| Chande Momentum Oscillator (20): | -0.430 | |
| Repulse (5,40,3): | -1.7180 | |
| ROCnROLL: | 2 | |
| TRIX (15,9): | -0.2640 | |
| Courbe Coppock: | 2.30 |
| MA7: | 3.549 | |
| MA20: | 3.506 | |
| MA50: | 3.687 | |
| MA100: | 3.637 | |
| MAexp7: | 3.409 | |
| MAexp20: | 3.533 | |
| MAexp50: | 3.633 | |
| MAexp100: | 3.846 | |
| Price / MA7: | -15.75% | |
| Price / MA20: | -14.72% | |
| Price / MA50: | -18.90% | |
| Price / MA100: | -17.79% | |
| Price / MAexp7: | -12.29% | |
| Price / MAexp20: | -15.37% | |
| Price / MAexp50: | -17.70% | |
| Price / MAexp100: | -22.26% |
News
Don't forget to follow the news on EKINOPS. At the time of publication of this analysis, the latest news was as follows:
- Ekinops H1 2024 revenue: 57.5 m€
- Orange Business launches its SD-WAN Essentials solution based on Ekinops' technology
- Ekinops acquires 120,914 of its own shares from a historical shareholder
- Ekinops celebrates the opening of its new headquarters and R&D hub for optical transport activities in Lannion
- Ekinops welcomes EUVIC as Strategic Optical Transport Channel Partner
About author

Online


Add a comment
Comments
0 comments on the analysis EKINOPS - Daily