| Open: | 6.55 |
| Change: | -0.12 |
| Volume: | 14,128,000 |
| Low: | 6.27 |
| High: | 6.79 |
| High / Low range: | 0.52 |
| Type: | Stocks |
| Ticker: | AKZA |
| ISIN: | NL0013267909 |
AKZO NOBEL - Daily - Technical analysis published on 11/08/2019 (GMT)
- 403
- 0
- 11/08/2019 - 12:45
- Who voted?
Click here for a new analysis!
- Timeframe : Daily
- - Analysis generated on 11/08/2019 - 12:45
- Status : INVALID
Summary of the analysis

Additional analysis
Quotes
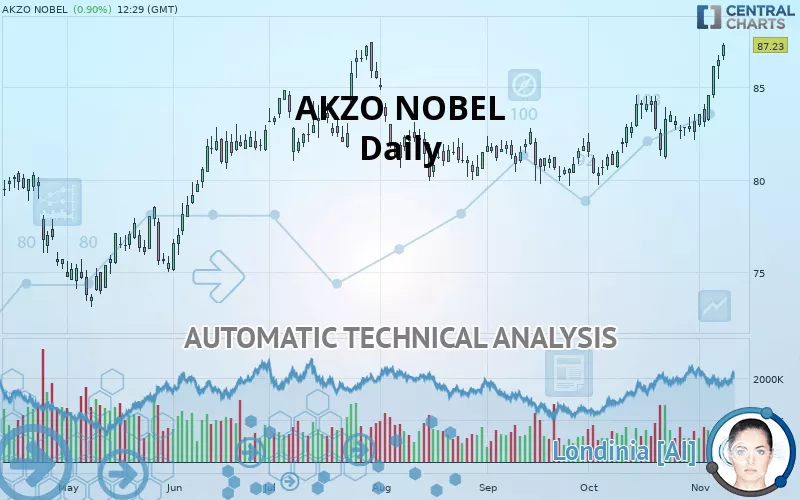
The AKZO NOBEL price is 87.23 EUR. On the day, this instrument gained +0.90% and was between 86.41 EUR and 87.33 EUR. This implies that the price is at +0.95% from its lowest and at -0.11% from its highest.A bullish opening was detected by the Central Gaps scanner. Buyers are trying to impose a bullish momentum in the very short term.
Bullish opening
Type : Bullish
Timeframe : Openning
Here is a more detailed summary of the historical variations registered by AKZO NOBEL:
New HIGH record (5 years)
Type : Bullish
Timeframe : Weekly
New HIGH record (1 year)
Type : Bullish
Timeframe : Weekly
New HIGH record (1st january)
Type : Bullish
Timeframe : Weekly
New HIGH record (1 month)
Type : Bullish
Timeframe : Weekly
Technical
Technical analysis of this Daily chart of AKZO NOBEL indicates that the overall trend is strongly bullish. 89.29% of the signals given by moving averages are bullish. This strongly bullish trend is supported by the strong bullish signals given by short-term moving averages. There is no crossing of moving average by the price or crossing of moving averages between themselves.
An assessment of technical indicators shows a strong bullish signal.
Caution: the Central Indicators scanner currently detects an excess:
RSI indicator is overbought : over 70
Type : Neutral
Timeframe : Daily
CCI indicator is overbought : over 100
Type : Neutral
Timeframe : Daily
Previous candle closed over Bollinger bands
Type : Neutral
Timeframe : Daily
Williams %R indicator is overbought : over -20
Type : Neutral
Timeframe : Daily
Pivot points : price is over resistance 1
Type : Neutral
Timeframe : Daily
Pivot points : price is over resistance 3
Type : Neutral
Timeframe : Weekly
An analysis of the price chart with the Central Patterns scanner (detector of chart patterns and resistances and supports) shows several results that can have an impact on the price change:
Near horizontal resistance
Type : Bearish
Timeframe : Daily
Resistance of channel is broken
Type : Bullish
Timeframe : Daily
Resistance of triangle is broken
Type : Bullish
Timeframe : Daily
The Central Candlesticks scanner which studies Japanese candlesticks did not detect anything.
| S3 | S2 | S1 | Price | |
|---|---|---|---|---|
| ProTrendLines | 80.17 | 83.29 | 87.18 | 87.23 |
| Change (%) | -8.09% | -4.52% | -0.06% | - |
| Change | -7.06 | -3.94 | -0.05 | - |
| Level | Major | Major | Major | - |
To determine price objectives, it is also possible to use the pivot points. Here is the price position in relation to pivot points:
| Pivot points | S3 | S2 | S1 | PP | R1 | R2 | R3 |
|---|---|---|---|---|---|---|---|
| Standard | 84.43 | 84.92 | 85.69 | 86.18 | 86.95 | 87.44 | 88.21 |
| Camarilla | 86.10 | 86.22 | 86.33 | 86.45 | 86.57 | 86.68 | 86.80 |
| Woodie | 84.56 | 84.99 | 85.82 | 86.25 | 87.08 | 87.51 | 88.34 |
| Fibonacci | 84.92 | 85.41 | 85.70 | 86.18 | 86.67 | 86.96 | 87.44 |
| Pivot points | S3 | S2 | S1 | PP | R1 | R2 | R3 |
|---|---|---|---|---|---|---|---|
| Standard | 81.17 | 81.65 | 82.59 | 83.07 | 84.01 | 84.49 | 85.43 |
| Camarilla | 83.14 | 83.27 | 83.40 | 83.53 | 83.66 | 83.79 | 83.92 |
| Woodie | 81.40 | 81.77 | 82.82 | 83.19 | 84.24 | 84.61 | 85.66 |
| Fibonacci | 81.65 | 82.19 | 82.53 | 83.07 | 83.61 | 83.95 | 84.49 |
| Pivot points | S3 | S2 | S1 | PP | R1 | R2 | R3 |
|---|---|---|---|---|---|---|---|
| Standard | 75.04 | 77.17 | 79.86 | 82.00 | 84.69 | 86.82 | 89.51 |
| Camarilla | 81.22 | 81.67 | 82.11 | 82.55 | 82.99 | 83.44 | 83.88 |
| Woodie | 75.31 | 77.31 | 80.14 | 82.14 | 84.96 | 86.96 | 89.79 |
| Fibonacci | 77.17 | 79.02 | 80.15 | 82.00 | 83.84 | 84.98 | 86.82 |
Numerical data
The following is the status of the technical indicators and moving averages at the time of publication of this technical analysis:
| RSI (14): | 75.63 | |
| MACD (12,26,9): | 1.1600 | |
| Directional Movement: | 16.09 | |
| AROON (14): | 85.71 | |
| DEMA (21): | 85.12 | |
| Parabolic SAR (0,02-0,02-0,2): | 82.09 | |
| Elder Ray (13): | 2.45 | |
| Super Trend (3,10): | 83.55 | |
| Zig ZAG (10): | 87.18 | |
| VORTEX (21): | 1.2000 | |
| Stochastique (14,3,5): | 97.95 | |
| TEMA (21): | 85.88 | |
| Williams %R (14): | -2.27 | |
| Chande Momentum Oscillator (20): | 4.38 | |
| Repulse (5,40,3): | 3.3900 | |
| ROCnROLL: | 1 | |
| TRIX (15,9): | 0.1300 | |
| Courbe Coppock: | 5.37 |
| MA7: | 84.91 | |
| MA20: | 83.60 | |
| MA50: | 81.94 | |
| MA100: | 82.11 | |
| MAexp7: | 85.36 | |
| MAexp20: | 83.78 | |
| MAexp50: | 82.54 | |
| MAexp100: | 81.41 | |
| Price / MA7: | +2.73% | |
| Price / MA20: | +4.34% | |
| Price / MA50: | +6.46% | |
| Price / MA100: | +6.24% | |
| Price / MAexp7: | +2.19% | |
| Price / MAexp20: | +4.12% | |
| Price / MAexp50: | +5.68% | |
| Price / MAexp100: | +7.15% |
News
The latest news and videos published on AKZO NOBEL at the time of the analysis were as follows:
- 07/24/2019 - 01:00 Akzo Nobel NV to Host Earnings Call
- 06/17/2019 - 06:00 AkzoNobel share buyback (June 10, 2019 - June 14, 2019)
- 06/10/2019 - 06:00 AkzoNobel share buyback (June 3, 2019 - June 7, 2019)
- 06/03/2019 - 06:00 AkzoNobel share buyback (May 27, 2019 - May 31, 2019)
- 05/27/2019 - 06:00 AkzoNobel share buyback (May 20, 2019 - May 23, 2019)
About author

Online


Add a comment
Comments
0 comments on the analysis AKZO NOBEL - Daily