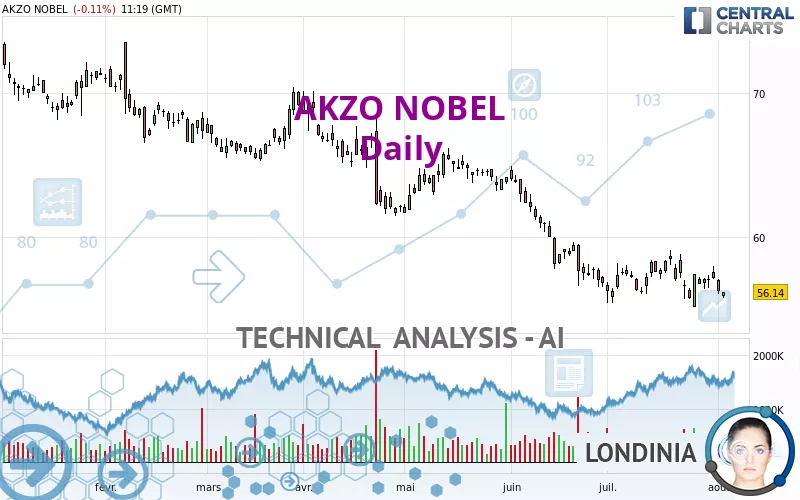
AKZO NOBEL - Daily - Technical analysis published on 08/02/2024 (GMT)
- 151
- 0
Click here for a new analysis!
- Timeframe : Daily
- - Analysis generated on
- Status : TARGET REACHED
Summary of the analysis

Additional analysis
Quotes
AKZO NOBEL rating 56.14 EUR. On the day, this instrument lost -0.11% and was between 55.70 EUR and 56.16 EUR. This implies that the price is at +0.79% from its lowest and at -0.04% from its highest.The Central Gaps scanner detects the formation of a bearish gap marking the strong presence of sellers ahead of buyers at the opening. This formed a quotation gap.
Opening Gap DOWN
Type : Bearish
Timeframe : Openning
So that you have an overall view of the price change, here is a table showing the variations over several periods:
Near a new LOW record (1 year)
Type : Bearish
Timeframe : Weekly
Near a new LOW record (1st january)
Type : Bearish
Timeframe : Weekly
Near a new LOW record (1 month)
Type : Bearish
Timeframe : Weekly
Technical
Technical analysis of AKZO NOBEL in Daily shows a overall strongly bearish trend. The signals given by moving averages are 92.86% bearish. This strong bearish trend is confirmed by the strong signals currently being given by short-term moving averages. The Central Indicators scanner does not detect any result on moving averages that would impact this trend.
The technical indicators are generally neutral. They do not provide relevant information on the direction of future price movements.
Caution: the Central Indicators scanner currently detects an excess:
CCI indicator is oversold : under -100
Type : Neutral
Timeframe : Daily
Price is back under the pivot point
Type : Bearish
Timeframe : Weekly
An analysis of the price chart with the Central Patterns scanner (detector of chart patterns and resistances and supports) shows several results that can have an impact on the price change:
Near support of channel
Type : Bullish
Timeframe : Daily
Horizontal support is broken
Type : Bearish
Timeframe : Daily
No result was found by the Central Candlesticks scanner on Japanese candlesticks.
| S3 | S2 | S1 | Price | R1 | R2 | R3 | |
|---|---|---|---|---|---|---|---|
| ProTrendLines | 34.20 | 43.44 | 52.96 | 56.14 | 56.18 | 59.49 | 65.74 |
| Change (%) | -39.08% | -22.62% | -5.66% | - | +0.07% | +5.97% | +17.10% |
| Change | -21.94 | -12.70 | -3.18 | - | +0.04 | +3.35 | +9.60 |
| Level | Intermediate | Intermediate | Intermediate | - | Major | Intermediate | Minor |
Pivot points can also be used to set your price objectives. Here is the price situation in relation to pivot points:
| Pivot points | S3 | S2 | S1 | PP | R1 | R2 | R3 |
|---|---|---|---|---|---|---|---|
| Standard | 54.81 | 55.43 | 55.81 | 56.43 | 56.81 | 57.43 | 57.81 |
| Camarilla | 55.93 | 56.02 | 56.11 | 56.20 | 56.29 | 56.38 | 56.48 |
| Woodie | 54.70 | 55.37 | 55.70 | 56.37 | 56.70 | 57.37 | 57.70 |
| Fibonacci | 55.43 | 55.81 | 56.05 | 56.43 | 56.81 | 57.05 | 57.43 |
| Pivot points | S3 | S2 | S1 | PP | R1 | R2 | R3 |
|---|---|---|---|---|---|---|---|
| Standard | 51.25 | 53.17 | 54.93 | 56.85 | 58.61 | 60.53 | 62.29 |
| Camarilla | 55.67 | 56.01 | 56.34 | 56.68 | 57.02 | 57.36 | 57.69 |
| Woodie | 51.16 | 53.13 | 54.84 | 56.81 | 58.52 | 60.49 | 62.20 |
| Fibonacci | 53.17 | 54.58 | 55.45 | 56.85 | 58.26 | 59.13 | 60.53 |
| Pivot points | S3 | S2 | S1 | PP | R1 | R2 | R3 |
|---|---|---|---|---|---|---|---|
| Standard | 51.17 | 53.13 | 55.13 | 57.09 | 59.09 | 61.05 | 63.05 |
| Camarilla | 56.03 | 56.39 | 56.76 | 57.12 | 57.48 | 57.85 | 58.21 |
| Woodie | 51.18 | 53.14 | 55.14 | 57.10 | 59.10 | 61.06 | 63.06 |
| Fibonacci | 53.13 | 54.65 | 55.58 | 57.09 | 58.61 | 59.54 | 61.05 |
Numerical data
The following is the status of technical indicators and moving averages registered at the time this technical analysis was created:
| RSI (14): | 41.79 | |
| MACD (12,26,9): | -0.6000 | |
| Directional Movement: | -6.65 | |
| AROON (14): | -35.71 | |
| DEMA (21): | 56.29 | |
| Parabolic SAR (0,02-0,02-0,2): | 57.98 | |
| Elder Ray (13): | -0.95 | |
| Super Trend (3,10): | 59.20 | |
| Zig ZAG (10): | 56.10 | |
| VORTEX (21): | 0.8400 | |
| Stochastique (14,3,5): | 34.68 | |
| TEMA (21): | 56.58 | |
| Williams %R (14): | -74.75 | |
| Chande Momentum Oscillator (20): | -2.16 | |
| Repulse (5,40,3): | -0.5900 | |
| ROCnROLL: | 2 | |
| TRIX (15,9): | -0.1500 | |
| Courbe Coppock: | 2.87 |
| MA7: | 56.77 | |
| MA20: | 57.11 | |
| MA50: | 58.89 | |
| MA100: | 61.67 | |
| MAexp7: | 56.65 | |
| MAexp20: | 57.16 | |
| MAexp50: | 58.75 | |
| MAexp100: | 60.95 | |
| Price / MA7: | -1.11% | |
| Price / MA20: | -1.70% | |
| Price / MA50: | -4.67% | |
| Price / MA100: | -8.97% | |
| Price / MAexp7: | -0.90% | |
| Price / MAexp20: | -1.78% | |
| Price / MAexp50: | -4.44% | |
| Price / MAexp100: | -7.89% |
News
The latest news and videos published on AKZO NOBEL at the time of the analysis were as follows:
- AkzoNobel Applauded by Frost & Sullivan for its commitment to pioneer digital transformation in the global paints and coatings industry
- AkzoNobel unveils new products and collaborations at METALCON and SEMA
- AkzoNobel shares sustainable architectural solutions at the International Greenbuild conference
- AkzoNobel Supports the Transportation Industry with Summer Travel
- AkzoNobel Advances Manufacturing and R&D in North America
About author
Online


Add a comment
Comments
0 comments on the analysis AKZO NOBEL - Daily