| Open: | 0.500000 |
| Change: | -0.010000 |
| Volume: | 2,222 |
| Low: | 0.480000 |
| High: | 0.510000 |
| High / Low range: | 0.030000 |
| Type: | Stocks |
| Ticker: | ECL |
| ISIN: |
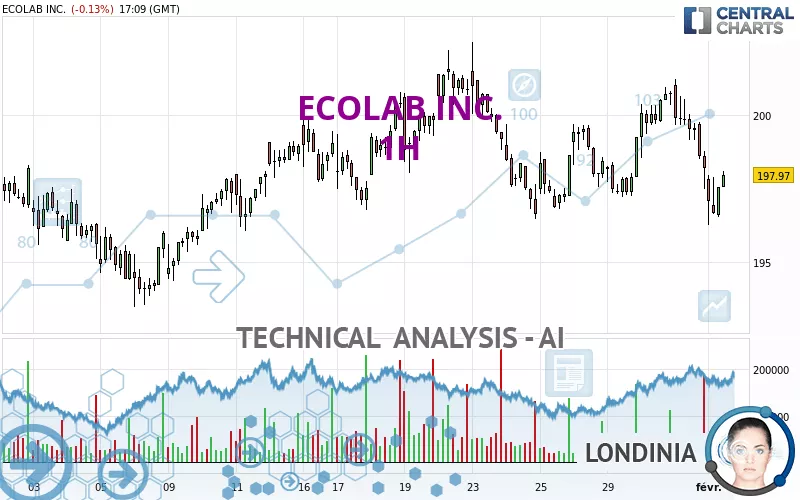
ECOLAB INC. - 1H - Technical analysis published on 02/01/2024 (GMT)
- 153
- 0
- 02/01/2024 - 17:25
Click here for a new analysis!
- Timeframe : 1H
- - Analysis generated on 02/01/2024 - 17:25
- Status : INVALID

Summary of the analysis

Additional analysis
Quotes
The ECOLAB INC. price is 197.89 USD. The price is lower by -0.17% since the last closing with the lowest point at 196.26 USD and the highest point at 198.09 USD. The deviation from the price is +0.83% for the low point and -0.10% for the high point.A bearish opening was detected by the Central Gaps scanner. Sellers are trying to impose a bearish trend in the very short term.
Bearish opening
Type : Bearish
Timeframe : Openning
Here is a more detailed summary of the historical variations registered by ECOLAB INC.:
Near a new HIGH record (1 year)
Type : Bullish
Timeframe : Weekly
Near a new HIGH record (1st january)
Type : Bullish
Timeframe : Weekly
Near a new HIGH record (1 month)
Type : Bullish
Timeframe : Weekly
Technical
A technical analysis in 1H of this ECOLAB INC. chart shows a bearish trend. 67.86% of the signals given by moving averages are bearish. This bearish trend is supported by the strong bearish signals given by short-term moving averages. The Central Indicators market scanner is currently detecting a bullish signal that could impact this trend:
Bullish trend reversal : Moving Average 100
Type : Bullish
Timeframe : 1 hour
In fact, 12 technical indicators on 18 studied are currently positioned bearish. But beware of excesses. The Central Indicators scanner currently detects this:
CCI indicator is oversold : under -100
Type : Neutral
Timeframe : 1 hour
Williams %R indicator is oversold : under -80
Type : Neutral
Timeframe : 1 hour
Central Patterns, the market scanner focusing on chart patterns, resistances and supports found these results:
Near horizontal support
Type : Bullish
Timeframe : 1 hour
Support of channel is broken
Type : Bearish
Timeframe : 1 hour
The Central Candlesticks scanner which studies Japanese candlesticks did not detect anything.
| S3 | S2 | S1 | Price | R1 | R2 | R3 | |
|---|---|---|---|---|---|---|---|
| ProTrendLines | 193.46 | 195.21 | 197.20 | 197.89 | 198.00 | 198.73 | 199.72 |
| Change (%) | -2.24% | -1.35% | -0.35% | - | +0.06% | +0.42% | +0.92% |
| Change | -4.43 | -2.68 | -0.69 | - | +0.11 | +0.84 | +1.83 |
| Level | Intermediate | Major | Intermediate | - | Minor | Minor | Major |
Pivot points can also be used to set your price objectives. Here is the price situation in relation to pivot points:
| Pivot points | S3 | S2 | S1 | PP | R1 | R2 | R3 |
|---|---|---|---|---|---|---|---|
| Standard | 192.95 | 195.21 | 196.71 | 198.97 | 200.47 | 202.73 | 204.23 |
| Camarilla | 197.19 | 197.53 | 197.88 | 198.22 | 198.57 | 198.91 | 199.25 |
| Woodie | 192.58 | 195.02 | 196.34 | 198.78 | 200.10 | 202.54 | 203.86 |
| Fibonacci | 195.21 | 196.64 | 197.53 | 198.97 | 200.40 | 201.29 | 202.73 |
| Pivot points | S3 | S2 | S1 | PP | R1 | R2 | R3 |
|---|---|---|---|---|---|---|---|
| Standard | 189.80 | 193.14 | 195.81 | 199.15 | 201.82 | 205.16 | 207.83 |
| Camarilla | 196.84 | 197.39 | 197.94 | 198.49 | 199.04 | 199.59 | 200.14 |
| Woodie | 189.48 | 192.97 | 195.49 | 198.98 | 201.50 | 204.99 | 207.51 |
| Fibonacci | 193.14 | 195.43 | 196.85 | 199.15 | 201.44 | 202.86 | 205.16 |
| Pivot points | S3 | S2 | S1 | PP | R1 | R2 | R3 |
|---|---|---|---|---|---|---|---|
| Standard | 184.61 | 189.03 | 193.63 | 198.05 | 202.65 | 207.07 | 211.67 |
| Camarilla | 195.74 | 196.57 | 197.39 | 198.22 | 199.05 | 199.87 | 200.70 |
| Woodie | 184.69 | 189.08 | 193.71 | 198.10 | 202.73 | 207.12 | 211.75 |
| Fibonacci | 189.03 | 192.48 | 194.61 | 198.05 | 201.50 | 203.63 | 207.07 |
Numerical data
The following is the status of the technical indicators and moving averages at the time of publication of this technical analysis:
| RSI (14): | 37.97 | |
| MACD (12,26,9): | -0.3400 | |
| Directional Movement: | -15.50 | |
| AROON (14): | -50.00 | |
| DEMA (21): | 198.43 | |
| Parabolic SAR (0,02-0,02-0,2): | 200.15 | |
| Elder Ray (13): | -1.52 | |
| Super Trend (3,10): | 200.08 | |
| Zig ZAG (10): | 197.41 | |
| VORTEX (21): | 0.9500 | |
| Stochastique (14,3,5): | 15.59 | |
| TEMA (21): | 198.04 | |
| Williams %R (14): | -74.19 | |
| Chande Momentum Oscillator (20): | -3.14 | |
| Repulse (5,40,3): | -0.0900 | |
| ROCnROLL: | 2 | |
| TRIX (15,9): | 0.0100 | |
| Courbe Coppock: | 1.32 |
| MA7: | 198.50 | |
| MA20: | 198.16 | |
| MA50: | 195.13 | |
| MA100: | 182.72 | |
| MAexp7: | 197.89 | |
| MAexp20: | 198.68 | |
| MAexp50: | 198.77 | |
| MAexp100: | 198.50 | |
| Price / MA7: | -0.31% | |
| Price / MA20: | -0.14% | |
| Price / MA50: | +1.41% | |
| Price / MA100: | +8.30% | |
| Price / MAexp7: | -0% | |
| Price / MAexp20: | -0.40% | |
| Price / MAexp50: | -0.44% | |
| Price / MAexp100: | -0.31% |
News
Don't forget to follow the news on ECOLAB INC.. At the time of publication of this analysis, the latest news was as follows:
- 03/23/2021 - 16:30 Ecolab Schedules Webcast and Conference Call on April 27
- 03/11/2021 - 08:30 Ecolab Comments on Effects of Texas/Gulf Coast Winter Freeze
- 06/03/2020 - 21:00 Ecolab Finalizes Separation of Its Upstream Energy Business and Merger of ChampionX With Apergy; Accepts Shares Tendered in Exchange Offer
- 06/03/2020 - 13:00 Ecolab’s AdvaCare™ Is the First Laundry Disinfectant and Oxidizer to Receive U.S. EPA Approval for Emerging Viral Pathogen Claim as Effective Against SARS-CoV-2, the Virus That Causes COVID-19
- 06/03/2020 - 12:30 Ecolab Announces Preliminary Results of Split-off Exchange Offer; Intends to Accept Tendered Shares and Expects Closing of the Apergy Transaction Today
About author
Online


Add a comment
Comments
0 comments on the analysis ECOLAB INC. - 1H