| Open: | - |
| Change: | - |
| Volume: | - |
| Low: | - |
| High: | - |
| High / Low range: | - |
| Type: | Stocks |
| Ticker: | ECL |
| ISIN: |
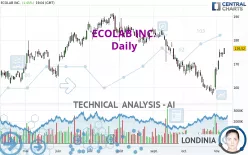
ECOLAB INC. - Daily - Technical analysis published on 11/08/2023 (GMT)
- 197
- 0
- 11/08/2023 - 19:20
Click here for a new analysis!
- Timeframe : Daily
- - Analysis generated on 11/08/2023 - 19:20
- Status : TARGET REACHED

Summary of the analysis

Additional analysis
Quotes
The ECOLAB INC. rating is 176.52 USD. The price registered an increase of +1.45% on the session with the lowest point at 174.08 USD and the highest point at 176.63 USD. The deviation from the price is +1.40% for the low point and -0.06% for the high point.The Central Gaps scanner detects a bullish opening. A small advantage for buyers in the very short term.
Bullish opening
Type : Bullish
Timeframe : Openning
A study of price movements over other periods shows the following variations:
New HIGH record (1 month)
Type : Bullish
Timeframe : Weekly
Technical
Technical analysis of this Daily chart of ECOLAB INC. indicates that the overall trend is not clearly defined. The strong bullish signals currently being given by short-term moving averages could allow the overall trend to return to bullish. An assessment of moving averages reveals a bullish signal that could impact this trend:
Bullish price crossover with adaptative moving average 100
Type : Bullish
Timeframe : Daily
An assessment of technical indicators shows a strong bullish signal.
Caution: the Central Indicators scanner currently detects an excess:
CCI indicator is overbought : over 100
Type : Neutral
Timeframe : Daily
Williams %R indicator is overbought : over -20
Type : Neutral
Timeframe : Daily
Pivot points : price is over resistance 2
Type : Neutral
Timeframe : Daily
The Central Patterns scanner, which studies chart patterns, resistances and supports, has identified these signals:
Near horizontal resistance
Type : Bearish
Timeframe : Daily
Resistance of channel is broken
Type : Bullish
Timeframe : Daily
No result was found by the Central Candlesticks scanner on Japanese candlesticks.
| S3 | S2 | S1 | Price | R1 | R2 | R3 | |
|---|---|---|---|---|---|---|---|
| ProTrendLines | 157.42 | 162.63 | 169.72 | 176.52 | 177.98 | 183.32 | 190.28 |
| Change (%) | -10.82% | -7.87% | -3.85% | - | +0.83% | +3.85% | +7.80% |
| Change | -19.10 | -13.89 | -6.80 | - | +1.46 | +6.80 | +13.76 |
| Level | Major | Intermediate | Major | - | Major | Intermediate | Intermediate |
Attention could also be paid to pivot points to set price objectives:
| Pivot points | S3 | S2 | S1 | PP | R1 | R2 | R3 |
|---|---|---|---|---|---|---|---|
| Standard | 170.74 | 171.77 | 172.88 | 173.91 | 175.02 | 176.05 | 177.16 |
| Camarilla | 173.41 | 173.61 | 173.80 | 174.00 | 174.20 | 174.39 | 174.59 |
| Woodie | 170.79 | 171.79 | 172.93 | 173.93 | 175.07 | 176.07 | 177.21 |
| Fibonacci | 171.77 | 172.58 | 173.09 | 173.91 | 174.72 | 175.23 | 176.05 |
| Pivot points | S3 | S2 | S1 | PP | R1 | R2 | R3 |
|---|---|---|---|---|---|---|---|
| Standard | 144.44 | 151.02 | 162.89 | 169.47 | 181.34 | 187.92 | 199.79 |
| Camarilla | 169.70 | 171.39 | 173.08 | 174.77 | 176.46 | 178.15 | 179.84 |
| Woodie | 147.10 | 152.34 | 165.55 | 170.79 | 184.00 | 189.24 | 202.45 |
| Fibonacci | 151.02 | 158.07 | 162.42 | 169.47 | 176.52 | 180.87 | 187.92 |
| Pivot points | S3 | S2 | S1 | PP | R1 | R2 | R3 |
|---|---|---|---|---|---|---|---|
| Standard | 145.07 | 150.89 | 159.32 | 165.14 | 173.57 | 179.39 | 187.82 |
| Camarilla | 163.82 | 165.13 | 166.43 | 167.74 | 169.05 | 170.35 | 171.66 |
| Woodie | 146.37 | 151.54 | 160.62 | 165.79 | 174.87 | 180.04 | 189.12 |
| Fibonacci | 150.89 | 156.34 | 159.70 | 165.14 | 170.59 | 173.95 | 179.39 |
Numerical data
The following is the status of the technical indicators and moving averages at the time of publication of this technical analysis:
| RSI (14): | 66.17 | |
| MACD (12,26,9): | 1.2000 | |
| Directional Movement: | 17.43 | |
| AROON (14): | 57.14 | |
| DEMA (21): | 168.52 | |
| Parabolic SAR (0,02-0,02-0,2): | 160.86 | |
| Elder Ray (13): | 6.19 | |
| Super Trend (3,10): | 165.57 | |
| Zig ZAG (10): | 176.39 | |
| VORTEX (21): | 1.0500 | |
| Stochastique (14,3,5): | 93.44 | |
| TEMA (21): | 172.14 | |
| Williams %R (14): | -0.76 | |
| Chande Momentum Oscillator (20): | 17.27 | |
| Repulse (5,40,3): | 3.3200 | |
| ROCnROLL: | 1 | |
| TRIX (15,9): | -0.1100 | |
| Courbe Coppock: | 10.23 |
| MA7: | 172.25 | |
| MA20: | 165.19 | |
| MA50: | 170.90 | |
| MA100: | 177.06 | |
| MAexp7: | 171.90 | |
| MAexp20: | 168.14 | |
| MAexp50: | 170.24 | |
| MAexp100: | 171.96 | |
| Price / MA7: | +2.48% | |
| Price / MA20: | +6.86% | |
| Price / MA50: | +3.29% | |
| Price / MA100: | -0.30% | |
| Price / MAexp7: | +2.69% | |
| Price / MAexp20: | +4.98% | |
| Price / MAexp50: | +3.69% | |
| Price / MAexp100: | +2.65% |
News
Don't forget to follow the news on ECOLAB INC.. At the time of publication of this analysis, the latest news was as follows:
- 03/23/2021 - 16:30 Ecolab Schedules Webcast and Conference Call on April 27
- 03/11/2021 - 08:30 Ecolab Comments on Effects of Texas/Gulf Coast Winter Freeze
- 06/03/2020 - 21:00 Ecolab Finalizes Separation of Its Upstream Energy Business and Merger of ChampionX With Apergy; Accepts Shares Tendered in Exchange Offer
- 06/03/2020 - 13:00 Ecolab’s AdvaCare™ Is the First Laundry Disinfectant and Oxidizer to Receive U.S. EPA Approval for Emerging Viral Pathogen Claim as Effective Against SARS-CoV-2, the Virus That Causes COVID-19
- 06/03/2020 - 12:30 Ecolab Announces Preliminary Results of Split-off Exchange Offer; Intends to Accept Tendered Shares and Expects Closing of the Apergy Transaction Today
About author
Online


Add a comment
Comments
0 comments on the analysis ECOLAB INC. - Daily