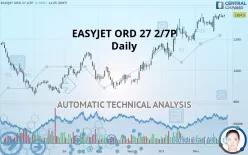
EASYJET ORD 27 2/7P - Daily - Technical analysis published on 11/28/2019 (GMT)
- 424
- 0
- Who voted?
Click here for a new analysis!
- Timeframe : Daily
- - Analysis generated on
- Status : INVALID

Summary of the analysis

Additional analysis
Quotes
EASYJET ORD 27 2/7P rating 1,354.5 GBX. On the day, this instrument gained +1.04% with the lowest point at 1,338.0 GBX and the highest point at 1,356.0 GBX. The deviation from the price is +1.23% for the low point and -0.11% for the high point.A bullish opening was detected by the Central Gaps scanner. Buyers are trying to impose a bullish momentum in the very short term.
Bullish opening
Type : Bullish
Timeframe : Openning
So that you have an overall view of the price change, here is a table showing the variations over several periods:
Near a new HIGH record (1st january)
Type : Bullish
Timeframe : Weekly
Near a new HIGH record (1 month)
Type : Bullish
Timeframe : Weekly
Technical
Technical analysis of this Daily chart of EASYJET ORD 27 2/7P indicates that the overall trend is strongly bullish. 92.86% of the signals given by moving averages are bullish. This strongly bullish trend is supported by the strong bullish signals given by short-term moving averages. The Central Indicators scanner does not detect any result on moving averages that would impact this trend.
An assessment of technical indicators shows a slightly bullish signal.
But beware of excesses. The Central Indicators scanner currently detects this:
Williams %R indicator is overbought : over -20
Type : Neutral
Timeframe : Daily
Pivot points : price is over resistance 1
Type : Neutral
Timeframe : Daily
Price is back over the pivot point
Type : Bullish
Timeframe : Weekly
Price is back under the pivot point
Type : Bearish
Timeframe : Daily
No signals are given by Central Patterns, a market scanner specialised in chart patterns, resistances and supports.
The Central Candlesticks scanner, specialised in Japanese candlesticks, did not identify any signals.
| S3 | S2 | S1 | Price | R1 | R2 | R3 | |
|---|---|---|---|---|---|---|---|
| ProTrendLines | 1,228.0 | 1,276.8 | 1,326.0 | 1,354.5 | 1,431.0 | 1,544.0 | 1,694.6 |
| Change (%) | -9.34% | -5.74% | -2.10% | - | +5.65% | +13.99% | +25.11% |
| Change | -126.5 | -77.7 | -28.5 | - | +76.5 | +189.5 | +340.1 |
| Level | Minor | Major | Major | - | Minor | Intermediate | Minor |
Attention could also be paid to pivot points to set price objectives:
| Pivot points | S3 | S2 | S1 | PP | R1 | R2 | R3 |
|---|---|---|---|---|---|---|---|
| Standard | 1,313.3 | 1,324.2 | 1,332.3 | 1,343.2 | 1,351.3 | 1,362.2 | 1,370.3 |
| Camarilla | 1,335.3 | 1,337.0 | 1,338.8 | 1,340.5 | 1,342.2 | 1,344.0 | 1,345.7 |
| Woodie | 1,312.0 | 1,323.5 | 1,331.0 | 1,342.5 | 1,350.0 | 1,361.5 | 1,369.0 |
| Fibonacci | 1,324.2 | 1,331.4 | 1,335.9 | 1,343.2 | 1,350.4 | 1,354.9 | 1,362.2 |
| Pivot points | S3 | S2 | S1 | PP | R1 | R2 | R3 |
|---|---|---|---|---|---|---|---|
| Standard | 1,159.8 | 1,203.2 | 1,275.3 | 1,318.7 | 1,390.8 | 1,434.2 | 1,506.3 |
| Camarilla | 1,315.7 | 1,326.3 | 1,336.9 | 1,347.5 | 1,358.1 | 1,368.7 | 1,379.3 |
| Woodie | 1,174.3 | 1,210.4 | 1,289.8 | 1,325.9 | 1,405.3 | 1,441.4 | 1,520.8 |
| Fibonacci | 1,203.2 | 1,247.3 | 1,274.6 | 1,318.7 | 1,362.8 | 1,390.1 | 1,434.2 |
| Pivot points | S3 | S2 | S1 | PP | R1 | R2 | R3 |
|---|---|---|---|---|---|---|---|
| Standard | 827.8 | 946.7 | 1,092.3 | 1,211.2 | 1,356.8 | 1,475.7 | 1,621.3 |
| Camarilla | 1,165.3 | 1,189.5 | 1,213.8 | 1,238.0 | 1,262.3 | 1,286.5 | 1,310.7 |
| Woodie | 841.3 | 953.4 | 1,105.8 | 1,217.9 | 1,370.3 | 1,482.4 | 1,634.8 |
| Fibonacci | 946.7 | 1,047.7 | 1,110.1 | 1,211.2 | 1,312.2 | 1,374.6 | 1,475.7 |
Numerical data
The following are the details of the technical indicators and moving averages that were collected to generate this technical analysis:
| RSI (14): | 63.70 | |
| MACD (12,26,9): | 34.8000 | |
| Directional Movement: | 7.5 | |
| AROON (14): | 35.7 | |
| DEMA (21): | 1,361.0 | |
| Parabolic SAR (0,02-0,02-0,2): | 1,251.2 | |
| Elder Ray (13): | 17.8 | |
| Super Trend (3,10): | 1,249.7 | |
| Zig ZAG (10): | 1,355.5 | |
| VORTEX (21): | 1.2000 | |
| Stochastique (14,3,5): | 83.30 | |
| TEMA (21): | 1,355.9 | |
| Williams %R (14): | -8.50 | |
| Chande Momentum Oscillator (20): | 49.0 | |
| Repulse (5,40,3): | 1.2000 | |
| ROCnROLL: | 1 | |
| TRIX (15,9): | 0.4000 | |
| Courbe Coppock: | 6.30 |
| MA7: | 1,346.0 | |
| MA20: | 1,320.8 | |
| MA50: | 1,235.6 | |
| MA100: | 1,110.7 | |
| MAexp7: | 1,341.9 | |
| MAexp20: | 1,312.2 | |
| MAexp50: | 1,236.7 | |
| MAexp100: | 1,162.3 | |
| Price / MA7: | +0.63% | |
| Price / MA20: | +2.55% | |
| Price / MA50: | +9.62% | |
| Price / MA100: | +21.95% | |
| Price / MAexp7: | +0.94% | |
| Price / MAexp20: | +3.22% | |
| Price / MAexp50: | +9.53% | |
| Price / MAexp100: | +16.54% |
News
The latest news and videos published on EASYJET ORD 27 2/7P at the time of the analysis were as follows:
-
 What to watch in easyJet's FY results
- CAE to train more than 1,000 new easyJet pilots under cadet training agreement
-
What to expect from easyJet after the collapse of Thomas Cook?
-
EasyJet Struggling With Brexit
-
EasyJet issues Brexit warning | Chart analysis
About author

Online


Add a comment
Comments
0 comments on the analysis EASYJET ORD 27 2/7P - Daily