EASYJET ORD 27 2/7P - is Approaching the 23.6% Fibonacci Retracement Level - 05/15/2017 (GMT)
- 1030
- 0
- Who voted?
- Timeframe : 4H
EASYJET ORD 27 2/7P Chart
Are you looking for opportunities in European stocks?
DISCOVER LONDINIA OPPORTUNITIES...
DISCOVER LONDINIA OPPORTUNITIES...
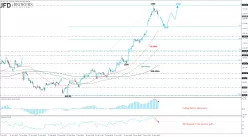
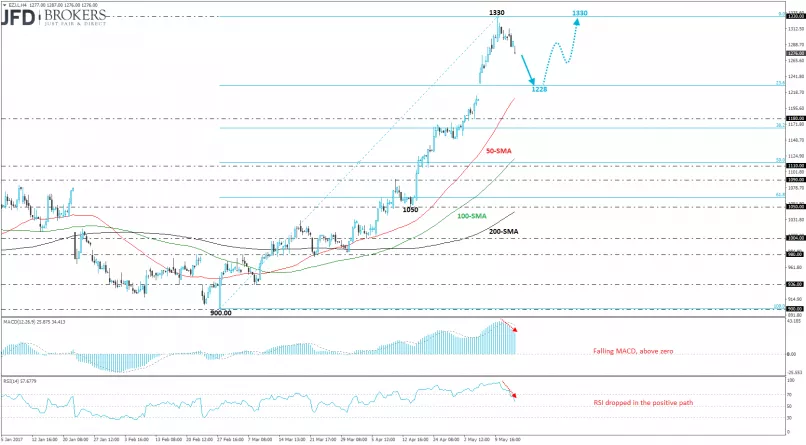
The EasyJet (LSE:EZJ.L) is a British airline based at London Luton Airport. The stock price has been developing within an uptrend since February of 2017 following the significant bounce off the $900.00 strong support level. The price headed to a fresh high over last week at $1.330 which is slightly below the 100-weekly SMA.
On the medium term, the price is having an aggressive run to the upside as it is recording the eighth positive month in a row. Over the last trading session the stock opened with a gap down and tried to recover it. The next level to watch to the upside is the $1.330 resistance level. On the other side, the 23.6% Fibonacci retracement level with low at $900.00 and high at $1.330 will act as a strong support level for the bulls. MACD and RSI are endorsing the second thought for a downward move and then back again to the previous high. MACD is falling and is holding below trigger line while RSI dropped below the overbought area.
On the medium term, the price is having an aggressive run to the upside as it is recording the eighth positive month in a row. Over the last trading session the stock opened with a gap down and tried to recover it. The next level to watch to the upside is the $1.330 resistance level. On the other side, the 23.6% Fibonacci retracement level with low at $900.00 and high at $1.330 will act as a strong support level for the bulls. MACD and RSI are endorsing the second thought for a downward move and then back again to the previous high. MACD is falling and is holding below trigger line while RSI dropped below the overbought area.
This member did not declare if he had a position on this financial instrument or a related financial instrument.
About author

Offline


Add a comment
Comments
0 comments on the analysis EASYJET ORD 27 2/7P - 4H