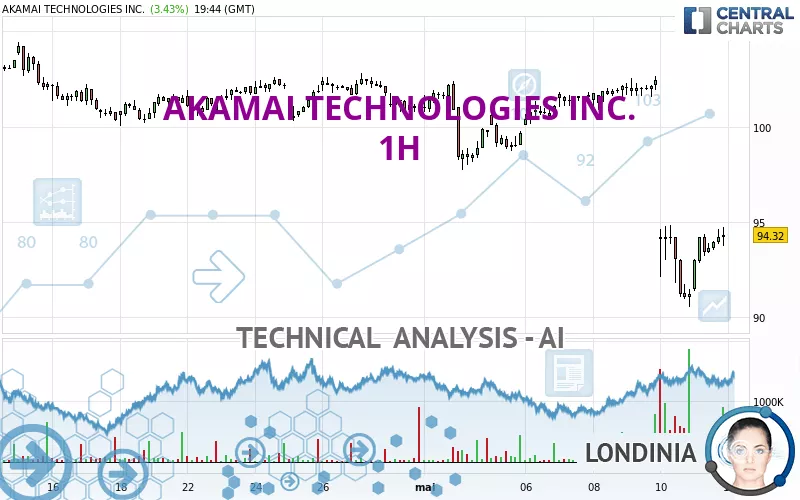
AKAMAI TECHNOLOGIES INC. - 1H - Technical analysis published on 05/13/2024 (GMT)
- 153
- 0
Click here for a new analysis!
- Timeframe : 1H
- - Analysis generated on
- Status : TARGET REACHED
Summary of the analysis

Additional analysis
Quotes
AKAMAI TECHNOLOGIES INC. rating 94.26 USD. The price registered an increase of +3.37% on the session with the lowest point at 91.39 USD and the highest point at 94.73 USD. The deviation from the price is +3.14% for the low point and -0.50% for the high point.The Central Gaps scanner detects a bullish opening marking the presence of buyers ahead of sellers at the opening but not sufficiently marked to allow the price to register a quotation gap.
Bullish opening
Type : Bullish
Timeframe : Openning
So that you have an overall view of the price change, here is a table showing the variations over several periods:
Near a new LOW record (1st january)
Type : Bearish
Timeframe : Weekly
Near a new LOW record (1 month)
Type : Bearish
Timeframe : Weekly
The Central Volumes scanner detects abnormal volumes on the asset:
Abnormal volumes
Timeframe : 5 days
Technical
A technical analysis in 1H of this AKAMAI TECHNOLOGIES INC. chart shows a sharp bearish trend. 92.86% of the signals given by moving averages are bearish. The overall trend is supported by the strong bearish signals from short-term moving averages. There is no crossing of moving average by the price or crossing of moving averages between themselves.
The technical indicators are bullish. There is still some doubt about the price increase.
Caution: the Central Indicators scanner currently detects an excess:
Williams %R indicator is overbought : over -20
Type : Neutral
Timeframe : 1 hour
Pivot points : price is over resistance 1
Type : Neutral
Timeframe : 1 hour
The Central Patterns scanner, which studies chart patterns, resistances and supports, has identified this signal:
Near horizontal resistance
Type : Bearish
Timeframe : 1 hour
The presence of a bearish pattern in Japanese candlesticks detected by Central Candlesticks that could cause a correction in the very short term was also detected:
Bearish harami
Type : Bearish
Timeframe : 1 hour
| S3 | S2 | S1 | Price | R1 | R2 | R3 | |
|---|---|---|---|---|---|---|---|
| ProTrendLines | 78.06 | 86.96 | 93.24 | 94.26 | 97.71 | 100.27 | 101.64 |
| Change (%) | -17.19% | -7.74% | -1.08% | - | +3.66% | +6.38% | +7.83% |
| Change | -16.20 | -7.30 | -1.02 | - | +3.45 | +6.01 | +7.38 |
| Level | Minor | Minor | Major | - | Minor | Minor | Intermediate |
To determine price objectives, it is also possible to use the pivot points. Here is the price position in relation to pivot points:
| Pivot points | S3 | S2 | S1 | PP | R1 | R2 | R3 |
|---|---|---|---|---|---|---|---|
| Standard | 85.25 | 87.89 | 89.54 | 92.18 | 93.83 | 96.47 | 98.12 |
| Camarilla | 90.01 | 90.40 | 90.80 | 91.19 | 91.58 | 91.98 | 92.37 |
| Woodie | 84.76 | 87.64 | 89.05 | 91.93 | 93.34 | 96.22 | 97.63 |
| Fibonacci | 87.89 | 89.53 | 90.54 | 92.18 | 93.82 | 94.83 | 96.47 |
| Pivot points | S3 | S2 | S1 | PP | R1 | R2 | R3 |
|---|---|---|---|---|---|---|---|
| Standard | 74.81 | 82.67 | 86.93 | 94.79 | 99.05 | 106.91 | 111.17 |
| Camarilla | 87.86 | 88.97 | 90.08 | 91.19 | 92.30 | 93.41 | 94.52 |
| Woodie | 73.01 | 81.77 | 85.13 | 93.89 | 97.25 | 106.01 | 109.37 |
| Fibonacci | 82.67 | 87.30 | 90.16 | 94.79 | 99.42 | 102.28 | 106.91 |
| Pivot points | S3 | S2 | S1 | PP | R1 | R2 | R3 |
|---|---|---|---|---|---|---|---|
| Standard | 87.35 | 93.68 | 97.31 | 103.64 | 107.27 | 113.60 | 117.23 |
| Camarilla | 98.19 | 99.10 | 100.02 | 100.93 | 101.84 | 102.76 | 103.67 |
| Woodie | 85.99 | 93.01 | 95.95 | 102.97 | 105.91 | 112.93 | 115.87 |
| Fibonacci | 93.68 | 97.49 | 99.84 | 103.64 | 107.45 | 109.80 | 113.60 |
Numerical data
The following is the status of technical indicators and moving averages registered at the time this technical analysis was created:
| RSI (14): | 40.27 | |
| MACD (12,26,9): | -1.8000 | |
| Directional Movement: | -15.96 | |
| AROON (14): | -50.00 | |
| DEMA (21): | 93.07 | |
| Parabolic SAR (0,02-0,02-0,2): | 95.23 | |
| Elder Ray (13): | -0.35 | |
| Super Trend (3,10): | 95.48 | |
| Zig ZAG (10): | 94.51 | |
| VORTEX (21): | 0.9600 | |
| Stochastique (14,3,5): | 51.31 | |
| TEMA (21): | 92.31 | |
| Williams %R (14): | -3.73 | |
| Chande Momentum Oscillator (20): | 0.50 | |
| Repulse (5,40,3): | 1.5600 | |
| ROCnROLL: | -1 | |
| TRIX (15,9): | -0.2900 | |
| Courbe Coppock: | 12.69 |
| MA7: | 98.98 | |
| MA20: | 100.42 | |
| MA50: | 105.02 | |
| MA100: | 111.57 | |
| MAexp7: | 93.99 | |
| MAexp20: | 95.48 | |
| MAexp50: | 97.90 | |
| MAexp100: | 99.60 | |
| Price / MA7: | -4.77% | |
| Price / MA20: | -6.13% | |
| Price / MA50: | -10.25% | |
| Price / MA100: | -15.51% | |
| Price / MAexp7: | +0.29% | |
| Price / MAexp20: | -1.28% | |
| Price / MAexp50: | -3.72% | |
| Price / MAexp100: | -5.36% |
News
Don't forget to follow the news on AKAMAI TECHNOLOGIES INC.. At the time of publication of this analysis, the latest news was as follows:
- AKAMAI REPORTS FIRST QUARTER 2024 FINANCIAL RESULTS
- Akamai Is Named a 2024 Stevie® Award Winner
- Akamai Announces Intent to Acquire API Security Company Noname
- Akamai Helps Organizations Achieve Greater Security with New Zero Trust Platform
- Akamai Announces 2023 Sustainability Report and Microsite
About author
Online


Add a comment
Comments
0 comments on the analysis AKAMAI TECHNOLOGIES INC. - 1H