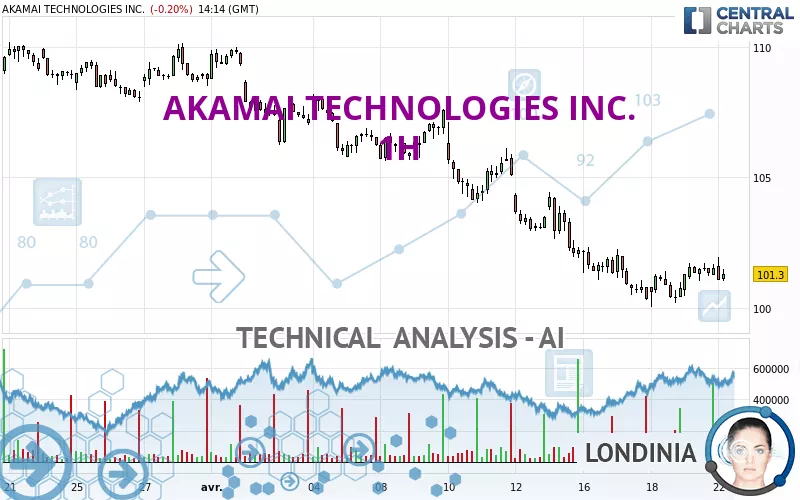
AKAMAI TECHNOLOGIES INC. - 1H - Technical analysis published on 04/22/2024 (GMT)
- 195
- 0
Click here for a new analysis!
- Timeframe : 1H
- - Analysis generated on
- Status : LEVEL MAINTAINED
Summary of the analysis

Additional analysis
Quotes
AKAMAI TECHNOLOGIES INC. rating 101.32 USD. The price registered a decrease of -0.18% on the session with the lowest point at 101.03 USD and the highest point at 101.94 USD. The deviation from the price is +0.29% for the low point and -0.61% for the high point.The Central Gaps scanner detects a bullish opening. A small advantage for buyers in the very short term.
Bullish opening
Type : Bullish
Timeframe : Openning
A study of price movements over other periods shows the following variations:
Near a new LOW record (1st january)
Type : Bearish
Timeframe : Weekly
Near a new LOW record (1 month)
Type : Bearish
Timeframe : Weekly
Technical
Technical analysis of this 1H chart of AKAMAI TECHNOLOGIES INC. indicates that the overall trend is bearish. The signals given by moving averages are 75.00% bearish. This bearish trend could slow down given the neutral signals currently being given by short-term moving averages. An assessment of moving averages reveals a bearish signal that could impact this trend:
Bearish trend reversal : adaptative moving average 20
Type : Bearish
Timeframe : 1 hour
In fact, only 9 technical indicators out of 18 studied are currently bullish. Central Indicators, the scanner specialised in technical indicators, has identified this signal:
Momentum indicator is back over 0
Type : Bullish
Timeframe : 1 hour
An analysis of the price chart with the Central Patterns scanner (detector of chart patterns and resistances and supports) shows several results that can have an impact on the price change:
Near resistance of channel
Type : Bearish
Timeframe : 1 hour
Near horizontal support
Type : Bullish
Timeframe : 1 hour
For a small rebound in the very short term, the Central Candlesticks scanner currently notes the presence of these bullish patterns in Japanese candlesticks:
Bullish harami
Type : Bullish
Timeframe : 1 hour
Bullish harami cross
Type : Bullish
Timeframe : 1 hour
| S3 | S2 | S1 | Price | R1 | R2 | R3 | |
|---|---|---|---|---|---|---|---|
| ProTrendLines | 86.96 | 93.24 | 100.21 | 101.32 | 101.39 | 105.63 | 107.05 |
| Change (%) | -14.17% | -7.97% | -1.10% | - | +0.07% | +4.25% | +5.66% |
| Change | -14.36 | -8.08 | -1.11 | - | +0.07 | +4.31 | +5.73 |
| Level | Minor | Major | Intermediate | - | Minor | Minor | Major |
To determine price objectives, it is also possible to use the pivot points. Here is the price position in relation to pivot points:
| Pivot points | S3 | S2 | S1 | PP | R1 | R2 | R3 |
|---|---|---|---|---|---|---|---|
| Standard | 99.46 | 99.95 | 100.73 | 101.22 | 102.00 | 102.49 | 103.27 |
| Camarilla | 101.15 | 101.27 | 101.38 | 101.50 | 101.62 | 101.73 | 101.85 |
| Woodie | 99.60 | 100.02 | 100.87 | 101.29 | 102.14 | 102.56 | 103.41 |
| Fibonacci | 99.95 | 100.44 | 100.74 | 101.22 | 101.71 | 102.01 | 102.49 |
| Pivot points | S3 | S2 | S1 | PP | R1 | R2 | R3 |
|---|---|---|---|---|---|---|---|
| Standard | 95.11 | 97.57 | 99.53 | 101.99 | 103.95 | 106.41 | 108.37 |
| Camarilla | 100.29 | 100.69 | 101.10 | 101.50 | 101.91 | 102.31 | 102.72 |
| Woodie | 94.87 | 97.45 | 99.29 | 101.87 | 103.71 | 106.29 | 108.13 |
| Fibonacci | 97.57 | 99.26 | 100.30 | 101.99 | 103.68 | 104.72 | 106.41 |
| Pivot points | S3 | S2 | S1 | PP | R1 | R2 | R3 |
|---|---|---|---|---|---|---|---|
| Standard | 99.38 | 103.09 | 105.93 | 109.64 | 112.48 | 116.19 | 119.03 |
| Camarilla | 106.96 | 107.56 | 108.16 | 108.76 | 109.36 | 109.96 | 110.56 |
| Woodie | 98.94 | 102.87 | 105.49 | 109.42 | 112.04 | 115.97 | 118.59 |
| Fibonacci | 103.09 | 105.60 | 107.14 | 109.64 | 112.15 | 113.69 | 116.19 |
Numerical data
The following are the details of the technical indicators and moving averages that were collected to generate this technical analysis:
| RSI (14): | 45.96 | |
| MACD (12,26,9): | -0.2200 | |
| Directional Movement: | -0.21 | |
| AROON (14): | 64.29 | |
| DEMA (21): | 100.91 | |
| Parabolic SAR (0,02-0,02-0,2): | 100.60 | |
| Elder Ray (13): | -0.09 | |
| Super Trend (3,10): | 102.23 | |
| Zig ZAG (10): | 101.17 | |
| VORTEX (21): | 0.9900 | |
| Stochastique (14,3,5): | 65.57 | |
| TEMA (21): | 101.29 | |
| Williams %R (14): | -40.91 | |
| Chande Momentum Oscillator (20): | 0.45 | |
| Repulse (5,40,3): | -0.1700 | |
| ROCnROLL: | -1 | |
| TRIX (15,9): | -0.0500 | |
| Courbe Coppock: | 1.10 |
| MA7: | 101.57 | |
| MA20: | 105.23 | |
| MA50: | 108.81 | |
| MA100: | 113.96 | |
| MAexp7: | 101.30 | |
| MAexp20: | 101.29 | |
| MAexp50: | 102.29 | |
| MAexp100: | 103.93 | |
| Price / MA7: | -0.25% | |
| Price / MA20: | -3.72% | |
| Price / MA50: | -6.88% | |
| Price / MA100: | -11.09% | |
| Price / MAexp7: | +0.02% | |
| Price / MAexp20: | +0.03% | |
| Price / MAexp50: | -0.95% | |
| Price / MAexp100: | -2.51% |
News
Don't forget to follow the news on AKAMAI TECHNOLOGIES INC.. At the time of publication of this analysis, the latest news was as follows:
- Akamai Technologies To Hold First Quarter 2024 Investor Conference Call On Thursday, May 9, at 4:30 PM ET
- Akamai Expands Offerings in Hybrid DNS Infrastructure Security with Shield NS53
- Akamai Research Finds 29% of Web Attacks Target APIs
- Akamai and Neural Magic Partner to Accelerate Deep Learning AI
- Scaleflex Joins Akamai Qualified Computing Partner Program
About author
Online


Add a comment
Comments
0 comments on the analysis AKAMAI TECHNOLOGIES INC. - 1H