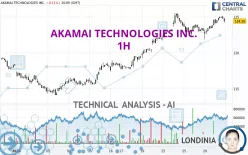
AKAMAI TECHNOLOGIES INC. - 1H - Technical analysis published on 01/30/2024 (GMT)
- 213
- 0
Click here for a new analysis!
- Timeframe : 1H
- - Analysis generated on
- Status : LEVEL MAINTAINED

Summary of the analysis

Additional analysis
Quotes
AKAMAI TECHNOLOGIES INC. rating 124.30 USD. The price is lower by -0.19% since the last closing and was between 124.09 USD and 125.10 USD. This implies that the price is at +0.17% from its lowest and at -0.64% from its highest.A bullish gap was detected at the opening by the Central Gaps scanner. There are a lot of buyers and they have the upper hand in the very short term.
Opening Gap UP
Type : Bullish
Timeframe : Openning
So that you have an overall view of the price change, here is a table showing the variations over several periods:
Near a new HIGH record (5 years)
Type : Bullish
Timeframe : Weekly
Near a new HIGH record (1 year)
Type : Bullish
Timeframe : Weekly
Near a new HIGH record (1st january)
Type : Bullish
Timeframe : Weekly
Near a new HIGH record (1 month)
Type : Bullish
Timeframe : Weekly
Technical
A technical analysis in 1H of this AKAMAI TECHNOLOGIES INC. chart shows a strongly bullish trend. 92.86% of the signals given by moving averages are bullish. This strongly bullish trend is supported by the strong bullish signals given by short-term moving averages. The Central Indicators market scanner currently does not detect any result that concerns moving averages.
In fact, 12 technical indicators on 18 studied are currently positioned bullish. Caution: the Central Indicators scanner currently detects an excess:
Williams %R indicator is overbought : over -20
Type : Neutral
Timeframe : 1 hour
Price is back over the pivot point
Type : Bullish
Timeframe : Weekly
The Central Patterns scanner, which studies chart patterns, resistances and supports, has identified these signals:
Near horizontal resistance
Type : Bearish
Timeframe : 1 hour
Resistance of channel is broken
Type : Bullish
Timeframe : 1 hour
The Central Candlesticks scanner, specialised in Japanese candlesticks, did not identify any signals.
| S3 | S2 | S1 | Price | R1 | |
|---|---|---|---|---|---|
| ProTrendLines | 118.87 | 121.92 | 123.94 | 124.30 | 125.50 |
| Change (%) | -4.37% | -1.91% | -0.29% | - | +0.97% |
| Change | -5.43 | -2.38 | -0.36 | - | +1.20 |
| Level | Intermediate | Major | Minor | - | Intermediate |
To determine price objectives, it is also possible to use the pivot points. Here is the price position in relation to pivot points:
| Pivot points | S3 | S2 | S1 | PP | R1 | R2 | R3 |
|---|---|---|---|---|---|---|---|
| Standard | 119.96 | 120.90 | 122.71 | 123.65 | 125.46 | 126.40 | 128.21 |
| Camarilla | 123.77 | 124.03 | 124.28 | 124.53 | 124.78 | 125.03 | 125.29 |
| Woodie | 120.41 | 121.12 | 123.16 | 123.87 | 125.91 | 126.62 | 128.66 |
| Fibonacci | 120.90 | 121.95 | 122.60 | 123.65 | 124.70 | 125.35 | 126.40 |
| Pivot points | S3 | S2 | S1 | PP | R1 | R2 | R3 |
|---|---|---|---|---|---|---|---|
| Standard | 116.47 | 118.77 | 120.91 | 123.21 | 125.35 | 127.65 | 129.79 |
| Camarilla | 121.84 | 122.25 | 122.65 | 123.06 | 123.47 | 123.87 | 124.28 |
| Woodie | 116.40 | 118.73 | 120.84 | 123.17 | 125.28 | 127.61 | 129.72 |
| Fibonacci | 118.77 | 120.46 | 121.51 | 123.21 | 124.90 | 125.95 | 127.65 |
| Pivot points | S3 | S2 | S1 | PP | R1 | R2 | R3 |
|---|---|---|---|---|---|---|---|
| Standard | 108.10 | 111.06 | 114.70 | 117.66 | 121.30 | 124.26 | 127.90 |
| Camarilla | 116.54 | 117.14 | 117.75 | 118.35 | 118.96 | 119.56 | 120.17 |
| Woodie | 108.45 | 111.23 | 115.05 | 117.83 | 121.65 | 124.43 | 128.25 |
| Fibonacci | 111.06 | 113.58 | 115.14 | 117.66 | 120.18 | 121.74 | 124.26 |
Numerical data
The following is the status of the technical indicators and moving averages at the time of publication of this technical analysis:
| RSI (14): | 59.74 | |
| MACD (12,26,9): | 0.4800 | |
| Directional Movement: | 8.25 | |
| AROON (14): | 85.72 | |
| DEMA (21): | 124.66 | |
| Parabolic SAR (0,02-0,02-0,2): | 123.31 | |
| Elder Ray (13): | 0.36 | |
| Super Trend (3,10): | 123.50 | |
| Zig ZAG (10): | 124.48 | |
| VORTEX (21): | 1.1600 | |
| Stochastique (14,3,5): | 89.65 | |
| TEMA (21): | 124.68 | |
| Williams %R (14): | -16.28 | |
| Chande Momentum Oscillator (20): | 1.55 | |
| Repulse (5,40,3): | -0.2200 | |
| ROCnROLL: | 1 | |
| TRIX (15,9): | 0.0400 | |
| Courbe Coppock: | 2.25 |
| MA7: | 123.52 | |
| MA20: | 119.29 | |
| MA50: | 117.46 | |
| MA100: | 111.97 | |
| MAexp7: | 124.55 | |
| MAexp20: | 124.06 | |
| MAexp50: | 122.99 | |
| MAexp100: | 121.40 | |
| Price / MA7: | +0.63% | |
| Price / MA20: | +4.20% | |
| Price / MA50: | +5.82% | |
| Price / MA100: | +11.01% | |
| Price / MAexp7: | -0.20% | |
| Price / MAexp20: | +0.19% | |
| Price / MAexp50: | +1.07% | |
| Price / MAexp100: | +2.39% |
News
The last news published on AKAMAI TECHNOLOGIES INC. at the time of the generation of this analysis was as follows:
- Akamai Technologies To Hold Fourth Quarter and Full-Year 2023 Investor Conference Call On Tuesday, February 13, at 4:30 PM ET
- Akamai Foundation Announces 2023 Grant Recipients
- Akamai Named to Environmental, Social, and Governance Stock Indexes
- Hydrolix Joins Akamai Qualified Computing Partner Program
- Akamai and Deloitte Announce Strategic Alliance to Deliver Zero Trust Segmentation and Managed Incident Response
About author
Online


Add a comment
Comments
0 comments on the analysis AKAMAI TECHNOLOGIES INC. - 1H