AKAMAI TECHNOLOGIES INC. - Daily - Technical analysis published on 11/10/2023 (GMT)
- 272
- 0
Click here for a new analysis!
- Timeframe : Daily
- - Analysis generated on
- Status : TARGET REACHED
Summary of the analysis

Additional analysis
Quotes
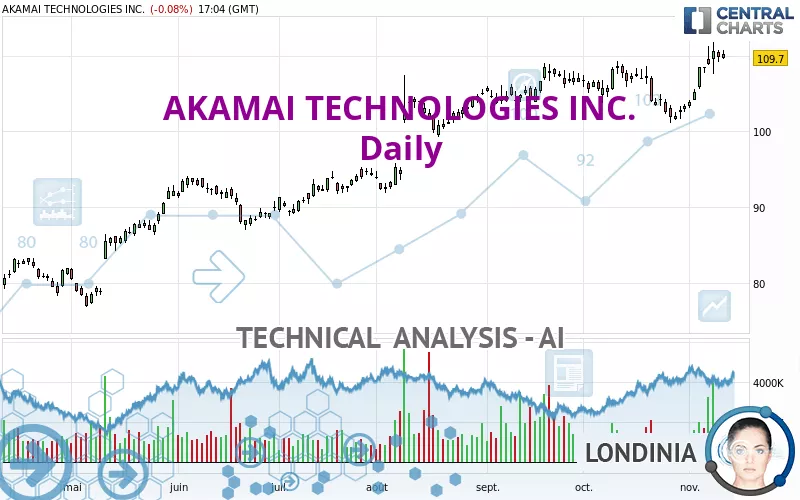
The AKAMAI TECHNOLOGIES INC. price is 109.69 USD. On the day, this instrument lost -0.09% and was between 109.53 USD and 110.68 USD. This implies that the price is at +0.15% from its lowest and at -0.89% from its highest.A bullish opening was detected by the Central Gaps scanner. Buyers are trying to impose a bullish momentum in the very short term.
Bullish opening
Type : Bullish
Timeframe : Openning
Here is a more detailed summary of the historical variations registered by AKAMAI TECHNOLOGIES INC.:
Near a new HIGH record (1 year)
Type : Bullish
Timeframe : Weekly
Near a new HIGH record (1st january)
Type : Bullish
Timeframe : Weekly
Near a new HIGH record (1 month)
Type : Bullish
Timeframe : Weekly
Technical
A technical analysis in Daily of this AKAMAI TECHNOLOGIES INC. chart shows a strongly bullish trend. The signals given by the moving averages are 89.29% bullish. This strong bullish trend is confirmed by the strong signals currently being given by short-term moving averages. There is no crossing of moving average by the price or crossing of moving averages between themselves.
In fact, 15 technical indicators on 18 studied are currently positioned bullish. Caution: the Central Indicators scanner currently detects an excess:
CCI indicator is overbought : over 100
Type : Neutral
Timeframe : Daily
Price is back under the pivot point
Type : Bearish
Timeframe : Daily
Central Patterns, the market scanner focusing on chart patterns, resistances and supports found these results:
Near resistance of channel
Type : Bearish
Timeframe : Daily
Near horizontal support
Type : Bullish
Timeframe : Daily
The Central Candlesticks scanner, specialised in Japanese candlesticks, did not identify any signals.
| S3 | S2 | S1 | Price | R1 | R2 | |
|---|---|---|---|---|---|---|
| ProTrendLines | 93.24 | 101.85 | 108.49 | 109.69 | 115.51 | 121.92 |
| Change (%) | -15.00% | -7.15% | -1.09% | - | +5.31% | +11.15% |
| Change | -16.45 | -7.84 | -1.20 | - | +5.82 | +12.23 |
| Level | Major | Intermediate | Major | - | Minor | Major |
To determine price objectives, it is also possible to use the pivot points. Here is the price position in relation to pivot points:
| Pivot points | S3 | S2 | S1 | PP | R1 | R2 | R3 |
|---|---|---|---|---|---|---|---|
| Standard | 107.39 | 108.28 | 109.03 | 109.92 | 110.67 | 111.56 | 112.31 |
| Camarilla | 109.34 | 109.49 | 109.64 | 109.79 | 109.94 | 110.09 | 110.24 |
| Woodie | 107.33 | 108.25 | 108.97 | 109.89 | 110.61 | 111.53 | 112.25 |
| Fibonacci | 108.28 | 108.90 | 109.29 | 109.92 | 110.54 | 110.93 | 111.56 |
| Pivot points | S3 | S2 | S1 | PP | R1 | R2 | R3 |
|---|---|---|---|---|---|---|---|
| Standard | 97.14 | 99.42 | 103.96 | 106.24 | 110.78 | 113.06 | 117.60 |
| Camarilla | 106.63 | 107.25 | 107.88 | 108.50 | 109.13 | 109.75 | 110.38 |
| Woodie | 98.27 | 99.99 | 105.09 | 106.81 | 111.91 | 113.63 | 118.73 |
| Fibonacci | 99.42 | 102.03 | 103.64 | 106.24 | 108.85 | 110.46 | 113.06 |
| Pivot points | S3 | S2 | S1 | PP | R1 | R2 | R3 |
|---|---|---|---|---|---|---|---|
| Standard | 91.80 | 96.47 | 99.90 | 104.57 | 108.00 | 112.67 | 116.10 |
| Camarilla | 101.10 | 101.85 | 102.59 | 103.33 | 104.07 | 104.82 | 105.56 |
| Woodie | 91.18 | 96.16 | 99.28 | 104.26 | 107.38 | 112.36 | 115.48 |
| Fibonacci | 96.47 | 99.56 | 101.48 | 104.57 | 107.66 | 109.58 | 112.67 |
Numerical data
The following is the status of the technical indicators and moving averages at the time of publication of this technical analysis:
| RSI (14): | 63.64 | |
| MACD (12,26,9): | 1.0500 | |
| Directional Movement: | 12.07 | |
| AROON (14): | 64.28 | |
| DEMA (21): | 107.85 | |
| Parabolic SAR (0,02-0,02-0,2): | 102.99 | |
| Elder Ray (13): | 2.74 | |
| Super Trend (3,10): | 104.53 | |
| Zig ZAG (10): | 109.60 | |
| VORTEX (21): | 1.0400 | |
| Stochastique (14,3,5): | 82.86 | |
| TEMA (21): | 108.45 | |
| Williams %R (14): | -21.15 | |
| Chande Momentum Oscillator (20): | 6.95 | |
| Repulse (5,40,3): | -0.6700 | |
| ROCnROLL: | 1 | |
| TRIX (15,9): | 0.0300 | |
| Courbe Coppock: | 6.44 |
| MA7: | 108.72 | |
| MA20: | 105.91 | |
| MA50: | 106.04 | |
| MA100: | 100.81 | |
| MAexp7: | 108.52 | |
| MAexp20: | 106.77 | |
| MAexp50: | 105.02 | |
| MAexp100: | 101.29 | |
| Price / MA7: | +0.89% | |
| Price / MA20: | +3.57% | |
| Price / MA50: | +3.44% | |
| Price / MA100: | +8.81% | |
| Price / MAexp7: | +1.08% | |
| Price / MAexp20: | +2.73% | |
| Price / MAexp50: | +4.45% | |
| Price / MAexp100: | +8.29% |
News
The latest news and videos published on AKAMAI TECHNOLOGIES INC. at the time of the analysis were as follows:
- Akamai and Deloitte Announce Strategic Alliance to Deliver Zero Trust Segmentation and Managed Incident Response
- AKAMAI REPORTS THIRD QUARTER 2023 FINANCIAL RESULTS
- Ransomware Attacks Have Doubled Over the Past Two Years, According to Akamai Research
- Akamai Strengthens DDoS Protection with Launch of Canadian Scrubbing Centers
- GlobalLogic and Akamai Announce Partnership to Deliver Enterprise Technology Solutions & Services
About author
Online


Add a comment
Comments
0 comments on the analysis AKAMAI TECHNOLOGIES INC. - Daily