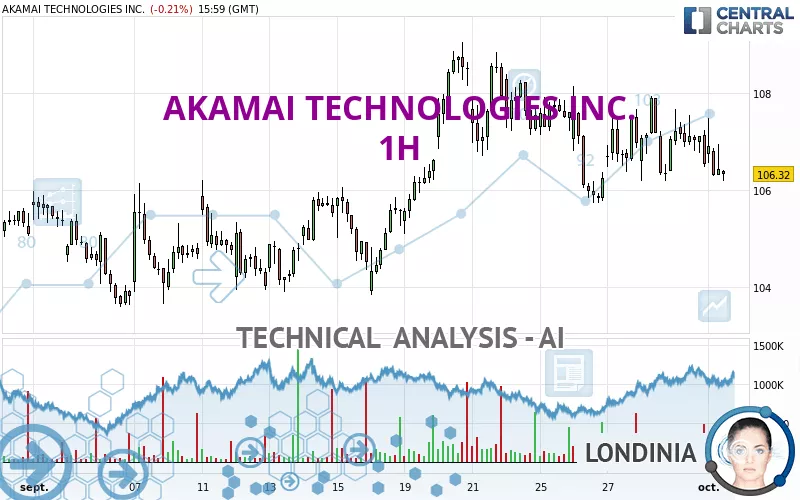
AKAMAI TECHNOLOGIES INC. - 1H - Technical analysis published on 10/02/2023 (GMT)
- 182
- 0
- Timeframe : 1H
- - Analysis generated on
- Status : NEUTRAL

Summary of the analysis

Additional analysis
Quotes
The AKAMAI TECHNOLOGIES INC. price is 106.43 USD. The price registered a decrease of -0.10% on the session and was between 106.28 USD and 107.48 USD. This implies that the price is at +0.14% from its lowest and at -0.98% from its highest.The Central Gaps scanner detects a bullish opening. A small advantage for buyers in the very short term.
Bullish opening
Type : Bullish
Timeframe : Openning
A study of price movements over other periods shows the following variations:
Near a new HIGH record (1 year)
Type : Bullish
Timeframe : Weekly
Near a new HIGH record (1st january)
Type : Bullish
Timeframe : Weekly
Near a new LOW record (1 month)
Type : Bearish
Timeframe : Weekly
Technical
Technical analysis of AKAMAI TECHNOLOGIES INC. in 1H shows a neutral overall trend. The slightly bearish signals currently given by short-term moving averages could allow the overall trend to return to a slightly bearish trend. The Central Indicators scanner detects a bullish signal on moving averages that could impact this trend:
Bullish price crossover with Moving Average 100
Type : Bullish
Timeframe : 1 hour
The technical indicators are generally neutral. They do not provide relevant information on the direction of future price movements.
Central Indicators, the detector scanner for these technical indicators recently detected a signal:
Momentum indicator is back over 0
Type : Bullish
Timeframe : 1 hour
Central Patterns, the market scanner focusing on chart patterns, resistances and supports found these results:
Near support of channel
Type : Bullish
Timeframe : 1 hour
Near support of triangle
Type : Bullish
Timeframe : 1 hour
No result was found by the Central Candlesticks scanner on Japanese candlesticks.
| S3 | S2 | S1 | Price | R1 | R2 | R3 | |
|---|---|---|---|---|---|---|---|
| ProTrendLines | 103.86 | 105.06 | 106.16 | 106.43 | 107.94 | 109.05 | 115.51 |
| Change (%) | -2.41% | -1.29% | -0.25% | - | +1.42% | +2.46% | +8.53% |
| Change | -2.57 | -1.37 | -0.27 | - | +1.51 | +2.62 | +9.08 |
| Level | Intermediate | Minor | Major | - | Intermediate | Minor | Minor |
Attention could also be paid to pivot points to set price objectives:
| Pivot points | S3 | S2 | S1 | PP | R1 | R2 | R3 |
|---|---|---|---|---|---|---|---|
| Standard | 104.92 | 105.69 | 106.12 | 106.89 | 107.32 | 108.09 | 108.52 |
| Camarilla | 106.21 | 106.32 | 106.43 | 106.54 | 106.65 | 106.76 | 106.87 |
| Woodie | 104.74 | 105.61 | 105.94 | 106.81 | 107.14 | 108.01 | 108.34 |
| Fibonacci | 105.69 | 106.15 | 106.44 | 106.89 | 107.35 | 107.64 | 108.09 |
| Pivot points | S3 | S2 | S1 | PP | R1 | R2 | R3 |
|---|---|---|---|---|---|---|---|
| Standard | 103.04 | 104.38 | 105.46 | 106.80 | 107.88 | 109.22 | 110.30 |
| Camarilla | 105.88 | 106.10 | 106.32 | 106.54 | 106.76 | 106.98 | 107.21 |
| Woodie | 102.91 | 104.32 | 105.33 | 106.74 | 107.75 | 109.16 | 110.17 |
| Fibonacci | 104.38 | 105.30 | 105.88 | 106.80 | 107.72 | 108.30 | 109.22 |
| Pivot points | S3 | S2 | S1 | PP | R1 | R2 | R3 |
|---|---|---|---|---|---|---|---|
| Standard | 98.26 | 100.92 | 103.73 | 106.39 | 109.20 | 111.86 | 114.67 |
| Camarilla | 105.04 | 105.54 | 106.04 | 106.54 | 107.04 | 107.54 | 108.04 |
| Woodie | 98.34 | 100.96 | 103.81 | 106.43 | 109.28 | 111.90 | 114.75 |
| Fibonacci | 100.92 | 103.01 | 104.30 | 106.39 | 108.48 | 109.77 | 111.86 |
Numerical data
The following are the details of the technical indicators and moving averages that were collected to generate this technical analysis:
| RSI (14): | 48.47 | |
| MACD (12,26,9): | -0.0800 | |
| Directional Movement: | 3.03 | |
| AROON (14): | -21.43 | |
| DEMA (21): | 106.79 | |
| Parabolic SAR (0,02-0,02-0,2): | 106.24 | |
| Elder Ray (13): | -0.20 | |
| Super Trend (3,10): | 105.52 | |
| Zig ZAG (10): | 106.71 | |
| VORTEX (21): | 0.9700 | |
| Stochastique (14,3,5): | 26.59 | |
| TEMA (21): | 106.71 | |
| Williams %R (14): | -69.71 | |
| Chande Momentum Oscillator (20): | 0.35 | |
| Repulse (5,40,3): | -0.2800 | |
| ROCnROLL: | 2 | |
| TRIX (15,9): | -0.0100 | |
| Courbe Coppock: | 0.50 |
| MA7: | 106.95 | |
| MA20: | 105.90 | |
| MA50: | 101.93 | |
| MA100: | 96.09 | |
| MAexp7: | 106.75 | |
| MAexp20: | 106.89 | |
| MAexp50: | 106.87 | |
| MAexp100: | 106.42 | |
| Price / MA7: | -0.49% | |
| Price / MA20: | +0.50% | |
| Price / MA50: | +4.41% | |
| Price / MA100: | +10.76% | |
| Price / MAexp7: | -0.30% | |
| Price / MAexp20: | -0.43% | |
| Price / MAexp50: | -0.41% | |
| Price / MAexp100: | +0.01% |
News
The latest news and videos published on AKAMAI TECHNOLOGIES INC. at the time of the analysis were as follows:
- Akamai Research Finds 65% Increase in Web Application and API Attacks on Financial Services
- Akamai Expands World's Most Distributed Cloud Network with New Core Compute Regions Across Asia, Europe, North America, and Latin America
- Ateme Joins Akamai Qualified Computing Partner Program
- Akamai Extends Its Industry-Leading DDoS Defense with Prolexic On-Prem and Hybrid Options Powered by Corero
- Cost Pressures, Viewer Expectations Play Prominently as M&E Businesses Seek Cloud Agility
About author
Online


Add a comment
Comments
0 comments on the analysis AKAMAI TECHNOLOGIES INC. - 1H