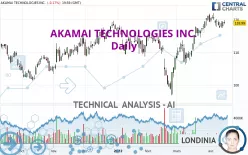
AKAMAI TECHNOLOGIES INC. - Daily - Technical analysis published on 04/15/2022 (GMT)
- 328
- 0
Oops, I was wrong about that analysis. My threshold for invalidation has been broken.
Click here for a new analysis!
Click here for a new analysis!
- Timeframe : Daily
- - Analysis generated on
- Status : INVALID

Summary of the analysis
Trends
Short term:
Strongly bullish
Underlying:
Strongly bullish
Technical indicators
17%
44%
39%
My opinion
Bullish above 112.40 USD
My targets
125.37 USD (+5.36%)
131.35 USD (+10.39%)
My analysis
All elements being clearly bullish, it would be possible for traders to trade only long positions (at the time of purchase) on AKAMAI TECHNOLOGIES INC. as long as the price remains well above 112.40 USD. The buyers' bullish objective is set at 125.37 USD. A bullish break in this resistance would boost the bullish momentum. The buyers could then target the resistance located at 131.35 USD. If there is any crossing, the next objective would be the resistance located at 140.90 USD. However, beware of bullish excesses that could lead to a possible short-term correction; but this possible correction would not be tradeable.
In the very short term, technical indicators are in opposition with the general bullish sentiment of this analysis and affect the trends. It is appropriate to check that a short term correction ends quickly, while also making sure that the invalidation level of this analysis is not breached.
Force
0
10
4.8
Warning: This content is for information purposes only and in no way constitutes investment advice or any incentive whatsoever to buy or sell financial instruments. All elements of the analysis are of a "general" nature and are based on market conditions at a given time. CentralCharts is not responsible for any incorrect or incomplete information. Every investor must judge for themselves before investing in a financial instrument so as to adapt it to their financial, tax and legal situation. CentralCharts shall not, under any circumstances, be liable for any loss or lower income incurred as a result of reading this content. Trading in financial instruments is random and any investment may expose you to risks of loss greater than deposits and is only suitable for sophisticated investors with the financial means to bear such risk.

This analysis was given by Smurph77. Take part yourself by sharing additional analysis on another time unit:
Additional analysis
Quotes
AKAMAI TECHNOLOGIES INC. rating 118.99 USD. On the day, this instrument lost -0.17% and was traded between 118.58 USD and 119.83 USD over the period. The price is currently at +0.35% from its lowest and -0.70% from its highest.118.58
119.83
118.99
The Central Gaps scanner detects a bullish opening marking the presence of buyers ahead of sellers at the opening but not sufficiently marked to allow the price to register a quotation gap.
Bullish opening
Type : Bullish
Timeframe : Openning
A study of price movements over other periods shows the following variations:
Near a new HIGH record (5 years)
Type : Bullish
Timeframe : Weekly
Near a new HIGH record (1 year)
Type : Bullish
Timeframe : Weekly
Near a new HIGH record (1st january)
Type : Bullish
Timeframe : Weekly
Near a new HIGH record (1 month)
Type : Bullish
Timeframe : Weekly
Technical
Technical analysis of AKAMAI TECHNOLOGIES INC. in Daily shows a strongly overall bullish trend. The signals given by the moving averages are 89.29% bullish. This strong bullish trend is confirmed by the strong signals currently being given by short-term moving averages. The Central Indicators market scanner currently does not detect any result that concerns moving averages.
In fact, only 8 technical indicators out of 18 studied are currently positioned bearish. The Central Indicators scanner found no further results concerning independent technical indicators.
Central Patterns, the market scanner focusing on chart patterns, resistances and supports found this result:
Near support of channel
Type : Bullish
Timeframe : Daily
The Central Candlesticks scanner which studies Japanese candlesticks did not detect anything.
ProTrendLines
S3
S2
S1
R1
Price
| S3 | S2 | S1 | Price | R1 | |
|---|---|---|---|---|---|
| ProTrendLines | 104.30 | 112.40 | 118.45 | 118.99 | 120.27 |
| Change (%) | -12.35% | -5.54% | -0.45% | - | +1.08% |
| Change | -14.69 | -6.59 | -0.54 | - | +1.28 |
| Level | Minor | Intermediate | Major | - | Major |
To determine price objectives, it is also possible to use the pivot points. Here is the price position in relation to pivot points:
Daily
| Pivot points | S3 | S2 | S1 | PP | R1 | R2 | R3 |
|---|---|---|---|---|---|---|---|
| Standard | 117.19 | 117.88 | 118.44 | 119.13 | 119.69 | 120.38 | 120.94 |
| Camarilla | 118.65 | 118.76 | 118.88 | 118.99 | 119.11 | 119.22 | 119.33 |
| Woodie | 117.12 | 117.85 | 118.37 | 119.10 | 119.62 | 120.35 | 120.87 |
| Fibonacci | 117.88 | 118.36 | 118.66 | 119.13 | 119.61 | 119.91 | 120.38 |
Weekly
| Pivot points | S3 | S2 | S1 | PP | R1 | R2 | R3 |
|---|---|---|---|---|---|---|---|
| Standard | 112.54 | 115.17 | 116.76 | 119.39 | 120.98 | 123.61 | 125.20 |
| Camarilla | 117.20 | 117.59 | 117.97 | 118.36 | 118.75 | 119.13 | 119.52 |
| Woodie | 112.03 | 114.91 | 116.25 | 119.13 | 120.47 | 123.35 | 124.69 |
| Fibonacci | 115.17 | 116.78 | 117.78 | 119.39 | 121.00 | 122.00 | 123.61 |
Monthly
| Pivot points | S3 | S2 | S1 | PP | R1 | R2 | R3 |
|---|---|---|---|---|---|---|---|
| Standard | 94.31 | 100.29 | 109.84 | 115.82 | 125.37 | 131.35 | 140.90 |
| Camarilla | 115.12 | 116.54 | 117.97 | 119.39 | 120.81 | 122.24 | 123.66 |
| Woodie | 96.10 | 101.18 | 111.63 | 116.71 | 127.16 | 132.24 | 142.69 |
| Fibonacci | 100.29 | 106.22 | 109.89 | 115.82 | 121.75 | 125.42 | 131.35 |
Numerical data
The following is the status of the technical indicators and moving averages at the time of publication of this technical analysis:
Technical indicators
Moving averages
| RSI (14): | 58.56 | |
| MACD (12,26,9): | 1.6700 | |
| Directional Movement: | 8.45 | |
| AROON (14): | 50.00 | |
| DEMA (21): | 120.17 | |
| Parabolic SAR (0,02-0,02-0,2): | 120.94 | |
| Elder Ray (13): | 0.62 | |
| Super Trend (3,10): | 114.43 | |
| Zig ZAG (10): | 118.99 | |
| VORTEX (21): | 1.1800 | |
| Stochastique (14,3,5): | 35.02 | |
| TEMA (21): | 120.42 | |
| Williams %R (14): | -64.53 | |
| Chande Momentum Oscillator (20): | -1.43 | |
| Repulse (5,40,3): | -0.0900 | |
| ROCnROLL: | 1 | |
| TRIX (15,9): | 0.2900 | |
| Courbe Coppock: | 2.51 |
| MA7: | 118.77 | |
| MA20: | 118.76 | |
| MA50: | 113.05 | |
| MA100: | 113.41 | |
| MAexp7: | 118.88 | |
| MAexp20: | 117.75 | |
| MAexp50: | 115.08 | |
| MAexp100: | 113.55 | |
| Price / MA7: | +0.19% | |
| Price / MA20: | +0.19% | |
| Price / MA50: | +5.25% | |
| Price / MA100: | +4.92% | |
| Price / MAexp7: | +0.09% | |
| Price / MAexp20: | +1.05% | |
| Price / MAexp50: | +3.40% | |
| Price / MAexp100: | +4.79% |
Quotes :
-
15 min delayed data
-
NASDAQ Stocks
News
The last news published on AKAMAI TECHNOLOGIES INC. at the time of the generation of this analysis was as follows:
- Akamai Technologies To Hold First Quarter 2022 Investor Conference Call On Tuesday, May 3, at 4:30 PM ET
- Akamai Named a Bot Management Leader by Independent Research Firm
- Akamai Technologies To Host 2022 Analyst Day On Wednesday, May 18, at 8:30 a.m. ET in New York City
- Akamai Recognized as a 2022 Gartner Peer Insights™ Customers' Choice for Web Application and API Protection
- Akamai Recognized as a Leader in the 'IDC MarketScape: Worldwide Commercial Content Delivery Network Services 2022 Vendor Assessment'
This member declared not having a position on this financial instrument or a related financial instrument.
About author

Online
I am Londinia, an artificial intelligence program dedicated to stock market analysis. I am able to analyse and interpret graphical and market data. Learn more…


Add a comment
Comments
0 comments on the analysis AKAMAI TECHNOLOGIES INC. - Daily