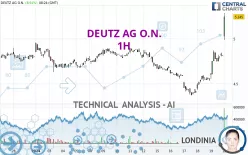
DEUTZ AG O.N. - 1H - Technical analysis published on 01/22/2024 (GMT)
- 156
- 0
Click here for a new analysis!
- Timeframe : 1H
- - Analysis generated on
- Status : INVALID

Summary of the analysis

Additional analysis
Quotes
DEUTZ AG O.N. rating 5.230 EUR. The price registered an increase of +8.60% on the session with the lowest point at 4.986 EUR and the highest point at 5.285 EUR. The deviation from the price is +4.89% for the low point and -1.04% for the high point.A bullish gap was detected at the opening by the Central Gaps scanner. There are a lot of buyers and they have the upper hand in the very short term.
Opening Gap UP
Type : Bullish
Timeframe : Openning
So that you have an overall view of the price change, here is a table showing the variations over several periods:
Near a new LOW record (1st january)
Type : Bearish
Timeframe : Weekly
Near a new LOW record (1 month)
Type : Bearish
Timeframe : Weekly
Technical
A technical analysis in 1H of this DEUTZ AG O.N. chart shows a strongly bullish trend. 82.14% of the signals given by moving averages are bullish. The overall trend is supported by the strong bullish signals from short-term moving averages. The Central Indicators scanner does not detect any result on moving averages that would impact this trend.
In fact, according to the parameters integrated into the Central Analyzer system, 17 technical indicators out of 18 analysed are currently bullish. But beware of excesses. The Central Indicators scanner currently detects this:
RSI indicator is overbought : over 80
Type : Neutral
Timeframe : 1 hour
CCI indicator is overbought : over 100
Type : Neutral
Timeframe : 1 hour
Williams %R indicator is overbought : over -20
Type : Neutral
Timeframe : 1 hour
Pivot points : price is over resistance 2
Type : Neutral
Timeframe : 1 hour
Pivot points : price is over resistance 2
Type : Neutral
Timeframe : Weekly
No signals are given by Central Patterns, a market scanner specialised in chart patterns, resistances and supports.
The presence of these bullish Japanese candlestick patterns detected by Central Candlesticks that could cause a very short term rebound were also noted:
Upside gap
Type : Bullish
Timeframe : 1 hour
Long white line
Type : Bullish
Timeframe : 1 hour
| S3 | S2 | S1 | Price | R1 | R2 | R3 | |
|---|---|---|---|---|---|---|---|
| ProTrendLines | 4.874 | 4.958 | 5.202 | 5.230 | 5.440 | 6.015 | 6.547 |
| Change (%) | -6.81% | -5.20% | -0.54% | - | +4.02% | +15.01% | +25.18% |
| Change | -0.356 | -0.272 | -0.028 | - | +0.210 | +0.785 | +1.317 |
| Level | Intermediate | Minor | Major | - | Major | Major | Intermediate |
Pivot points can also be used to set your price objectives. Here is the price situation in relation to pivot points:
| Pivot points | S3 | S2 | S1 | PP | R1 | R2 | R3 |
|---|---|---|---|---|---|---|---|
| Standard | 4.304 | 4.428 | 4.622 | 4.746 | 4.940 | 5.064 | 5.258 |
| Camarilla | 4.729 | 4.758 | 4.787 | 4.816 | 4.845 | 4.874 | 4.904 |
| Woodie | 4.339 | 4.446 | 4.657 | 4.764 | 4.975 | 5.082 | 5.293 |
| Fibonacci | 4.428 | 4.550 | 4.625 | 4.746 | 4.868 | 4.943 | 5.064 |
| Pivot points | S3 | S2 | S1 | PP | R1 | R2 | R3 |
|---|---|---|---|---|---|---|---|
| Standard | 4.004 | 4.188 | 4.502 | 4.686 | 5.000 | 5.184 | 5.498 |
| Camarilla | 4.679 | 4.725 | 4.770 | 4.816 | 4.862 | 4.907 | 4.953 |
| Woodie | 4.069 | 4.221 | 4.567 | 4.719 | 5.065 | 5.217 | 5.563 |
| Fibonacci | 4.188 | 4.378 | 4.496 | 4.686 | 4.876 | 4.994 | 5.184 |
| Pivot points | S3 | S2 | S1 | PP | R1 | R2 | R3 |
|---|---|---|---|---|---|---|---|
| Standard | 3.550 | 3.840 | 4.320 | 4.610 | 5.090 | 5.380 | 5.860 |
| Camarilla | 4.588 | 4.659 | 4.729 | 4.800 | 4.871 | 4.941 | 5.012 |
| Woodie | 3.645 | 3.888 | 4.415 | 4.658 | 5.185 | 5.428 | 5.955 |
| Fibonacci | 3.840 | 4.134 | 4.316 | 4.610 | 4.904 | 5.086 | 5.380 |
Numerical data
The following is the status of technical indicators and moving averages registered at the time this technical analysis was created:
| RSI (14): | 81.62 | |
| MACD (12,26,9): | 0.1030 | |
| Directional Movement: | 57.477 | |
| AROON (14): | 71.429 | |
| DEMA (21): | 4.847 | |
| Parabolic SAR (0,02-0,02-0,2): | 4.785 | |
| Elder Ray (13): | 0.317 | |
| Super Trend (3,10): | 4.843 | |
| Zig ZAG (10): | 5.245 | |
| VORTEX (21): | 1.2620 | |
| Stochastique (14,3,5): | 91.18 | |
| TEMA (21): | 4.958 | |
| Williams %R (14): | 0.00 | |
| Chande Momentum Oscillator (20): | 0.708 | |
| Repulse (5,40,3): | 6.7750 | |
| ROCnROLL: | 1 | |
| TRIX (15,9): | 0.1650 | |
| Courbe Coppock: | 15.64 |
| MA7: | 4.718 | |
| MA20: | 4.761 | |
| MA50: | 4.492 | |
| MA100: | 4.258 | |
| MAexp7: | 4.903 | |
| MAexp20: | 4.734 | |
| MAexp50: | 4.676 | |
| MAexp100: | 4.682 | |
| Price / MA7: | +10.85% | |
| Price / MA20: | +9.85% | |
| Price / MA50: | +16.43% | |
| Price / MA100: | +22.83% | |
| Price / MAexp7: | +6.67% | |
| Price / MAexp20: | +10.48% | |
| Price / MAexp50: | +11.85% | |
| Price / MAexp100: | +11.70% |
News
The last news published on DEUTZ AG O.N. at the time of the generation of this analysis was as follows:
- EQS-Adhoc: DEUTZ AG: DEUTZ AG and Rolls-Royce’s Power Systems Business Unit reach general agreement on the takeover of engine platforms
- EQS-News: DEUTZ generates further profitable growth in the third quarter and raises its full-year earnings guidance for 2023 – first H2 volume production order received
- EQS-News: DEUTZ AG: Jump in profits for DEUTZ in the first half of 2023
- EQS-News: DEUTZ AG: DEUTZ earnings soar in the first quarter of 2023
- EQS-Adhoc: DEUTZ AG: DEUTZ refines full-year 2023 guidance after better than expected start into the year
About author
Online


Add a comment
Comments
0 comments on the analysis DEUTZ AG O.N. - 1H