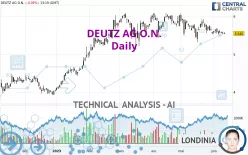
DEUTZ AG O.N. - Daily - Technical analysis published on 06/12/2023 (GMT)
- 178
- 0
Click here for a new analysis!
- Timeframe : Daily
- - Analysis generated on
- Status : TARGET REACHED

Summary of the analysis

Additional analysis
Quotes
The DEUTZ AG O.N. rating is 5.545 EUR. On the day, this instrument lost -0.09% with the lowest point at 5.530 EUR and the highest point at 5.580 EUR. The deviation from the price is +0.27% for the low point and -0.63% for the high point.The Central Gaps scanner detects a bearish opening. A small advantage for sellers in the very short term.
Bearish opening
Type : Bearish
Timeframe : Openning
A study of price movements over other periods shows the following variations:
Near a new LOW record (1 month)
Type : Bearish
Timeframe : Weekly
Technical
Technical analysis of this Daily chart of DEUTZ AG O.N. indicates that the overall trend is not clearly defined. This indecision could turn into a bearish trend due to the strong bearish signals currently being given by short-term moving averages. The Central Indicators market scanner is currently detecting a bearish signal that could impact this trend:
Bearish trend reversal : Moving Average 50
Type : Bearish
Timeframe : Daily
An assessment of technical indicators does not currently provide any relevant information on the direction of future price movements.
Caution: the Central Indicators scanner currently detects an excess:
Williams %R indicator is oversold : under -80
Type : Neutral
Timeframe : Daily
Ichimoku - Bearish crossover : Tenkan & Kijun
Type : Bearish
Timeframe : Daily
Central Patterns, the market scanner focusing on chart patterns, resistances and supports found these results:
Near resistance of triangle
Type : Bearish
Timeframe : Daily
Near horizontal support
Type : Bullish
Timeframe : Daily
Near support of channel
Type : Bullish
Timeframe : Daily
The Central Candlesticks scanner which studies Japanese candlesticks did not detect anything.
| S3 | S2 | S1 | Price | R1 | R2 | R3 | |
|---|---|---|---|---|---|---|---|
| ProTrendLines | 3.850 | 4.113 | 5.202 | 5.545 | 5.548 | 6.015 | 6.593 |
| Change (%) | -30.57% | -25.83% | -6.19% | - | +0.05% | +8.48% | +18.90% |
| Change | -1.695 | -1.432 | -0.343 | - | +0.003 | +0.470 | +1.048 |
| Level | Minor | Major | Intermediate | - | Major | Major | Minor |
Attention could also be paid to pivot points to set price objectives:
| Pivot points | S3 | S2 | S1 | PP | R1 | R2 | R3 |
|---|---|---|---|---|---|---|---|
| Standard | 5.447 | 5.483 | 5.517 | 5.553 | 5.587 | 5.623 | 5.657 |
| Camarilla | 5.531 | 5.537 | 5.544 | 5.550 | 5.556 | 5.563 | 5.569 |
| Woodie | 5.445 | 5.483 | 5.515 | 5.553 | 5.585 | 5.623 | 5.655 |
| Fibonacci | 5.483 | 5.510 | 5.527 | 5.553 | 5.580 | 5.597 | 5.623 |
| Pivot points | S3 | S2 | S1 | PP | R1 | R2 | R3 |
|---|---|---|---|---|---|---|---|
| Standard | 5.333 | 5.427 | 5.488 | 5.582 | 5.643 | 5.737 | 5.798 |
| Camarilla | 5.507 | 5.522 | 5.536 | 5.550 | 5.564 | 5.578 | 5.593 |
| Woodie | 5.318 | 5.419 | 5.473 | 5.574 | 5.628 | 5.729 | 5.783 |
| Fibonacci | 5.427 | 5.486 | 5.523 | 5.582 | 5.641 | 5.678 | 5.737 |
| Pivot points | S3 | S2 | S1 | PP | R1 | R2 | R3 |
|---|---|---|---|---|---|---|---|
| Standard | 4.465 | 4.890 | 5.220 | 5.645 | 5.975 | 6.400 | 6.730 |
| Camarilla | 5.342 | 5.412 | 5.481 | 5.550 | 5.619 | 5.688 | 5.758 |
| Woodie | 4.418 | 4.866 | 5.173 | 5.621 | 5.928 | 6.376 | 6.683 |
| Fibonacci | 4.890 | 5.178 | 5.357 | 5.645 | 5.933 | 6.112 | 6.400 |
Numerical data
The following is the status of technical indicators and moving averages registered at the time this technical analysis was created:
| RSI (14): | 44.58 | |
| MACD (12,26,9): | -0.0390 | |
| Directional Movement: | -9.551 | |
| AROON (14): | -42.857 | |
| DEMA (21): | 5.582 | |
| Parabolic SAR (0,02-0,02-0,2): | 5.889 | |
| Elder Ray (13): | -0.048 | |
| Super Trend (3,10): | 5.438 | |
| Zig ZAG (10): | 5.550 | |
| VORTEX (21): | 0.9000 | |
| Stochastique (14,3,5): | 11.91 | |
| TEMA (21): | 5.540 | |
| Williams %R (14): | -87.72 | |
| Chande Momentum Oscillator (20): | -0.085 | |
| Repulse (5,40,3): | -0.1560 | |
| ROCnROLL: | 2 | |
| TRIX (15,9): | -0.0760 | |
| Courbe Coppock: | 5.02 |
| MA7: | 5.583 | |
| MA20: | 5.636 | |
| MA50: | 5.700 | |
| MA100: | 5.500 | |
| MAexp7: | 5.577 | |
| MAexp20: | 5.626 | |
| MAexp50: | 5.615 | |
| MAexp100: | 5.386 | |
| Price / MA7: | -0.68% | |
| Price / MA20: | -1.61% | |
| Price / MA50: | -2.72% | |
| Price / MA100: | +0.82% | |
| Price / MAexp7: | -0.57% | |
| Price / MAexp20: | -1.44% | |
| Price / MAexp50: | -1.25% | |
| Price / MAexp100: | +2.95% |
News
The last news published on DEUTZ AG O.N. at the time of the generation of this analysis was as follows:
- EQS-News: DEUTZ AG: DEUTZ earnings soar in the first quarter of 2023
- EQS-Adhoc: DEUTZ AG: DEUTZ refines full-year 2023 guidance after better than expected start into the year
- EQS-News: DEUTZ AG: Completion of cooperation between DEUTZ and Daimler Truck
- EQS-News: DEUTZ AG: DEUTZ significantly increases its profit in 2022 and pursues further growth with its Dual+ strategy
- EQS-News: DEUTZ AG: DEUTZ enters into cooperation with Daimler Truck to develop and market medium- and heavy-duty engines
About author
Online


Add a comment
Comments
0 comments on the analysis DEUTZ AG O.N. - Daily