TONNER DRONES - Daily - Technical analysis published on 09/09/2024 (GMT)
- 113
- 0
- Timeframe : Daily
- - Analysis generated on
- Status : NEUTRAL
Summary of the analysis

Additional analysis
Quotes
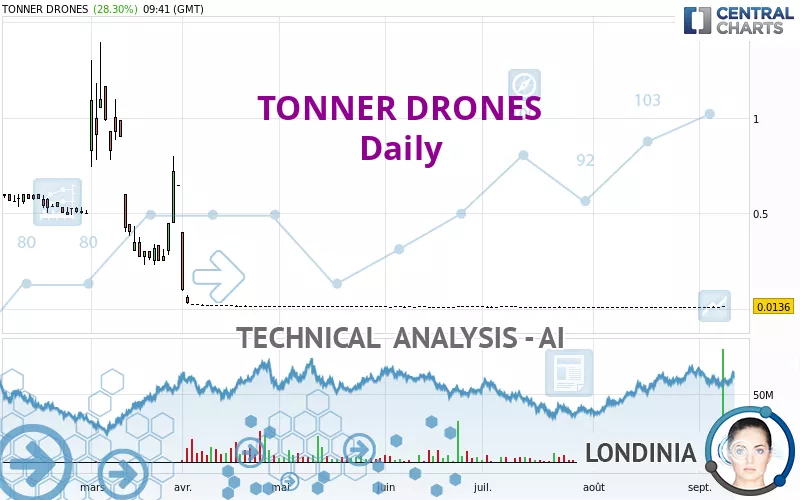
TONNER DRONES rating 0.0136 EUR. On the day, this instrument gained +28.30% and was between 0.0116 EUR and 0.0142 EUR. This implies that the price is at +17.24% from its lowest and at -4.23% from its highest.A bullish gap was detected at the opening by the Central Gaps scanner. There are a lot of buyers and they have the upper hand in the very short term.
Opening Gap UP
Type : Bullish
Timeframe : Openning
Here is a more detailed summary of the historical variations registered by TONNER DRONES:
New HIGH record (1 month)
Type : Bullish
Timeframe : Weekly
The Central Volumes scanner notes the presence of abnormal volumes:
Abnormal volumes
Timeframe : 5 days
Abnormal volumes
Timeframe : 20 days
Technical
A technical analysis in Daily of this TONNER DRONES chart shows a slightly bearish trend. 53.57% of the signals given by moving averages are bearish. Caution: the slightly bullish signals currently given by short-term moving averages could cause a reversal of the trend. The Central Indicators market scanner is currently detecting several bullish signals that could impact this trend:
Bullish price crossover with Moving Average 50
Type : Bullish
Timeframe : Daily
Bullish price crossover with Moving Average 100
Type : Bullish
Timeframe : Daily
In fact, according to the parameters integrated into the Central Analyzer system, 14 technical indicators out of 18 analysed are currently bullish. Caution: the Central Indicators scanner currently detects an excess:
CCI indicator is overbought : over 100
Type : Neutral
Timeframe : Daily
Williams %R indicator is overbought : over -20
Type : Neutral
Timeframe : Daily
Pivot points : price is over resistance 2
Type : Neutral
Timeframe : Weekly
Pivot points : price is over resistance 3
Type : Neutral
Timeframe : Daily
RSI indicator is back over 50
Type : Bullish
Timeframe : Daily
Ichimoku : price is over the cloud
Type : Bullish
Timeframe : Daily
SuperTrend indicator bullish reversal
Type : Bullish
Timeframe : Daily
MACD indicator is back over 0
Type : Bullish
Timeframe : Daily
An analysis of the price chart with the Central Patterns scanner (detector of chart patterns and resistances and supports) shows a result that can have an impact on the price change:
Horizontal resistance is broken
Type : Bullish
Timeframe : Daily
Central Candlesticks, the scanner specialised in Japanese candlesticks, detects a bullish signal that could support the hypothesis of a small rebound in the very short term:
Long white line
Type : Bullish
Timeframe : Daily
| S1 | Price | R1 | R2 | R3 | |
|---|---|---|---|---|---|
| ProTrendLines | 0.0112 | 0.0136 | 0.3149 | 0.8100 | 1.1000 |
| Change (%) | -17.65% | - | +2,215.44% | +5,855.88% | +7,988.24% |
| Change | -0.0024 | - | +0.3013 | +0.7964 | +1.0864 |
| Level | Minor | - | Minor | Minor | Major |
Pivot points can also be used to set your price objectives. Here is the price situation in relation to pivot points:
| Pivot points | S3 | S2 | S1 | PP | R1 | R2 | R3 |
|---|---|---|---|---|---|---|---|
| Standard | 0.0092 | 0.0098 | 0.0102 | 0.0108 | 0.0112 | 0.0118 | 0.0122 |
| Camarilla | 0.0103 | 0.0104 | 0.0105 | 0.0106 | 0.0107 | 0.0108 | 0.0109 |
| Woodie | 0.0091 | 0.0098 | 0.0101 | 0.0108 | 0.0111 | 0.0118 | 0.0121 |
| Fibonacci | 0.0098 | 0.0102 | 0.0104 | 0.0108 | 0.0112 | 0.0114 | 0.0118 |
| Pivot points | S3 | S2 | S1 | PP | R1 | R2 | R3 |
|---|---|---|---|---|---|---|---|
| Standard | 0.0074 | 0.0086 | 0.0096 | 0.0108 | 0.0118 | 0.0130 | 0.0140 |
| Camarilla | 0.0100 | 0.0102 | 0.0104 | 0.0106 | 0.0108 | 0.0110 | 0.0112 |
| Woodie | 0.0073 | 0.0086 | 0.0095 | 0.0108 | 0.0117 | 0.0130 | 0.0139 |
| Fibonacci | 0.0086 | 0.0094 | 0.0100 | 0.0108 | 0.0116 | 0.0122 | 0.0130 |
| Pivot points | S3 | S2 | S1 | PP | R1 | R2 | R3 |
|---|---|---|---|---|---|---|---|
| Standard | 0.0075 | 0.0083 | 0.0095 | 0.0103 | 0.0115 | 0.0123 | 0.0135 |
| Camarilla | 0.0101 | 0.0102 | 0.0104 | 0.0106 | 0.0108 | 0.0110 | 0.0112 |
| Woodie | 0.0076 | 0.0084 | 0.0096 | 0.0104 | 0.0116 | 0.0124 | 0.0136 |
| Fibonacci | 0.0083 | 0.0091 | 0.0096 | 0.0103 | 0.0111 | 0.0116 | 0.0123 |
Numerical data
The following is the status of technical indicators and moving averages registered at the time this technical analysis was created:
| RSI (14): | 68.21 | |
| MACD (12,26,9): | 0.0002 | |
| Directional Movement: | 30.0821 | |
| AROON (14): | 78.5714 | |
| DEMA (21): | 0.0109 | |
| Parabolic SAR (0,02-0,02-0,2): | 0.0093 | |
| Elder Ray (13): | 0.0019 | |
| Super Trend (3,10): | 0.0096 | |
| Zig ZAG (10): | 0.0138 | |
| VORTEX (21): | 0.9787 | |
| Stochastique (14,3,5): | 73.52 | |
| TEMA (21): | 0.0118 | |
| Williams %R (14): | -8.00 | |
| Chande Momentum Oscillator (20): | 0.0030 | |
| Repulse (5,40,3): | 19.9428 | |
| ROCnROLL: | -1 | |
| TRIX (15,9): | -0.0200 | |
| Courbe Coppock: | 9.94 |
| MA7: | 0.0111 | |
| MA20: | 0.0107 | |
| MA50: | 0.0107 | |
| MA100: | 0.0115 | |
| MAexp7: | 0.0115 | |
| MAexp20: | 0.0108 | |
| MAexp50: | 0.0168 | |
| MAexp100: | 0.0789 | |
| Price / MA7: | +22.52% | |
| Price / MA20: | +27.10% | |
| Price / MA50: | +27.10% | |
| Price / MA100: | +18.26% | |
| Price / MAexp7: | +18.26% | |
| Price / MAexp20: | +25.93% | |
| Price / MAexp50: | -19.05% | |
| Price / MAexp100: | -82.76% |
News
The last news published on TONNER DRONES at the time of the generation of this analysis was as follows:
- Tonner Drones announces the free allocation of share warrants to all its shareholders
- Results Annual General Meeting
- Update on Core Assets and Strategies
- Tonner Drones Exits Last Variable Pricing Instrument
- TONNER DRONES announces the postponement of the publication of its 2023 annual accounts and its annual financial report
About author

Online


Add a comment
Comments
0 comments on the analysis TONNER DRONES - Daily