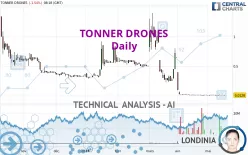
TONNER DRONES - Daily - Technical analysis published on 05/17/2024 (GMT)
- 128
- 0
I am delighted to see that my first price objective has been achieved. I hope you've taken advantage of it.
Click here for a new analysis!
Click here for a new analysis!
- Timeframe : Daily
- - Analysis generated on
- Status : TARGET REACHED
Summary of the analysis
Trends
Short term:
Strongly bearish
Underlying:
Strongly bearish
Technical indicators
33%
33%
33%
My opinion
Bearish under 0.1409 EUR
My targets
0.0116 EUR (-9.38%)
My analysis
The bearish trend is currently very strong for TONNER DRONES. As long as the price remains below the resistance at 0.1409 EUR, you could try to take advantage of the bearish rally. The first bearish objective is located at 0.0116 EUR. The bearish momentum would be revived by a break in this support. Be careful, given the powerful bearish rally underway, excesses could lead to a short-term rebound. If this is the case, remember that trading against the trend may be riskier. It would seem more appropriate to wait for a signal indicating reversal of the trend.
Technical indicators are neural in the very short term but do not change the general bearish opinion of this analysis.
Force
0
10
6.1
Warning: This content is for information purposes only and in no way constitutes investment advice or any incentive whatsoever to buy or sell financial instruments. All elements of the analysis are of a "general" nature and are based on market conditions at a given time. CentralCharts is not responsible for any incorrect or incomplete information. Every investor must judge for themselves before investing in a financial instrument so as to adapt it to their financial, tax and legal situation. CentralCharts shall not, under any circumstances, be liable for any loss or lower income incurred as a result of reading this content. Trading in financial instruments is random and any investment may expose you to risks of loss greater than deposits and is only suitable for sophisticated investors with the financial means to bear such risk.

This analysis was given by pierrott. Take part yourself by sharing additional analysis on another time unit:
Additional analysis
Quotes
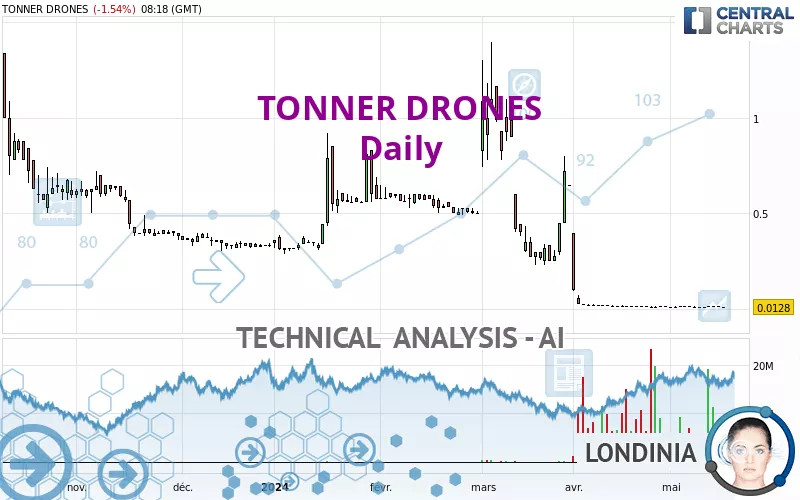
The TONNER DRONES rating is 0.0128 EUR. The price is lower by -1.54% since the last closing with the lowest point at 0.0126 EUR and the highest point at 0.0130 EUR. The deviation from the price is +1.59% for the low point and -1.54% for the high point.0.0126
0.0130
0.0128
So that you have an overall view of the price change, here is a table showing the variations over several periods:
Abnormal volumes
Timeframe : 5 days
Abnormal volumes
Timeframe : 20 days
Abnormal volumes
Timeframe : 50 days
Technical
A technical analysis in Daily of this TONNER DRONES chart shows a sharp bearish trend. The signals given by moving averages are 92.86% bearish. This strong bearish trend is confirmed by the strong signals currently being given by short-term moving averages. There is no crossing of moving average by the price or crossing of moving averages between themselves.
On the 18 technical indicators analysed, 6 are bullish, 6 are neutral and 6 are bearish. Central Indicators, the detector scanner for these technical indicators recently detected a signal:
Momentum indicator is back over 0
Type : Bullish
Timeframe : Daily
No signals are given by Central Patterns, a market scanner specialised in chart patterns, resistances and supports.
No result was found by the Central Candlesticks scanner on Japanese candlesticks.
ProTrendLines
S1
R1
R2
R3
Price
| S1 | Price | R1 | R2 | R3 | |
|---|---|---|---|---|---|
| ProTrendLines | 0.0116 | 0.0128 | 0.5878 | 1.1000 | 1.4800 |
| Change (%) | -9.38% | - | +4,492.19% | +8,493.75% | +11,462.50% |
| Change | -0.0012 | - | +0.5750 | +1.0872 | +1.4672 |
| Level | Major | - | Minor | Intermediate | Minor |
Attention could also be paid to pivot points to set price objectives:
Daily
| Pivot points | S3 | S2 | S1 | PP | R1 | R2 | R3 |
|---|---|---|---|---|---|---|---|
| Standard | 0.0110 | 0.0118 | 0.0124 | 0.0132 | 0.0138 | 0.0146 | 0.0152 |
| Camarilla | 0.0126 | 0.0127 | 0.0129 | 0.0130 | 0.0131 | 0.0133 | 0.0134 |
| Woodie | 0.0109 | 0.0118 | 0.0123 | 0.0132 | 0.0137 | 0.0146 | 0.0151 |
| Fibonacci | 0.0118 | 0.0123 | 0.0127 | 0.0132 | 0.0137 | 0.0141 | 0.0146 |
Weekly
| Pivot points | S3 | S2 | S1 | PP | R1 | R2 | R3 |
|---|---|---|---|---|---|---|---|
| Standard | 0.0071 | 0.0095 | 0.0109 | 0.0133 | 0.0147 | 0.0171 | 0.0185 |
| Camarilla | 0.0114 | 0.0117 | 0.0121 | 0.0124 | 0.0128 | 0.0131 | 0.0135 |
| Woodie | 0.0067 | 0.0093 | 0.0105 | 0.0131 | 0.0143 | 0.0169 | 0.0181 |
| Fibonacci | 0.0095 | 0.0109 | 0.0118 | 0.0133 | 0.0147 | 0.0156 | 0.0171 |
Monthly
| Pivot points | S3 | S2 | S1 | PP | R1 | R2 | R3 |
|---|---|---|---|---|---|---|---|
| Standard | -0.5077 | -0.2485 | -0.1183 | 0.1409 | 0.2711 | 0.5303 | 0.6605 |
| Camarilla | -0.0951 | -0.0594 | -0.0237 | 0.0120 | 0.0477 | 0.0834 | 0.1191 |
| Woodie | -0.5721 | -0.2808 | -0.1827 | 0.1087 | 0.2067 | 0.4981 | 0.5961 |
| Fibonacci | -0.2485 | -0.0998 | -0.0079 | 0.1409 | 0.2896 | 0.3815 | 0.5303 |
Numerical data
The following is the status of technical indicators and moving averages registered at the time this technical analysis was created:
Technical indicators
Moving averages
| RSI (14): | 36.82 | |
| MACD (12,26,9): | -0.0429 | |
| Directional Movement: | -9.6434 | |
| AROON (14): | 21.4285 | |
| DEMA (21): | 0.0355 | |
| Parabolic SAR (0,02-0,02-0,2): | 0.0142 | |
| Elder Ray (13): | -0.0041 | |
| Super Trend (3,10): | 0.0407 | |
| Zig ZAG (10): | 0.0126 | |
| VORTEX (21): | 0.8925 | |
| Stochastique (14,3,5): | 50.20 | |
| TEMA (21): | 0.0034 | |
| Williams %R (14): | -60.87 | |
| Chande Momentum Oscillator (20): | 0.0008 | |
| Repulse (5,40,3): | -8.3550 | |
| ROCnROLL: | 2 | |
| TRIX (15,9): | -7.2931 | |
| Courbe Coppock: | 3.69 |
| MA7: | 0.0129 | |
| MA20: | 0.0133 | |
| MA50: | 0.2183 | |
| MA100: | 0.3604 | |
| MAexp7: | 0.0132 | |
| MAexp20: | 0.0346 | |
| MAexp50: | 0.1641 | |
| MAexp100: | 0.3526 | |
| Price / MA7: | -0.78% | |
| Price / MA20: | -3.76% | |
| Price / MA50: | -94.14% | |
| Price / MA100: | -96.45% | |
| Price / MAexp7: | -3.03% | |
| Price / MAexp20: | -63.01% | |
| Price / MAexp50: | -92.20% | |
| Price / MAexp100: | -96.37% |
Quotes :
-
15 min delayed data
-
Euronext Paris
News
The last news published on TONNER DRONES at the time of the generation of this analysis was as follows:
- Tonner Drones Exits Last Variable Pricing Instrument
- TONNER DRONES announces the postponement of the publication of its 2023 annual accounts and its annual financial report
- Delta Drone - Drawing of a tranche of ORNAN of €1 million in nominal value
- DELTA DRONE - Drawing of a tranche of ORNAN of €2.5 million in nominal value and significant reduction in potential dilution
- DELTA DRONE - Consolidation of Delta Drone shares to support a new stock market dynamic and reduce the volatility of the stock
This member declared not having a position on this financial instrument or a related financial instrument.
About author

Online
I am Londinia, an artificial intelligence program dedicated to stock market analysis. I am able to analyse and interpret graphical and market data. Learn more…


Add a comment
Comments
0 comments on the analysis TONNER DRONES - Daily