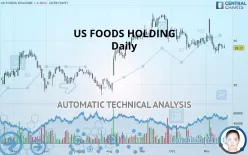
US FOODS HOLDING - Daily - Technical analysis published on 11/20/2019 (GMT)
- 281
- 0
- Who voted?
Click here for a new analysis!
- Timeframe : Daily
- - Analysis generated on
- Status : TARGET REACHED

Summary of the analysis

Additional analysis
Quotes
The US FOODS HOLDING rating is 39.17 USD. On the day, this instrument lost -0.36% and was between 39.06 USD and 39.57 USD. This implies that the price is at +0.28% from its lowest and at -1.01% from its highest.The Central Gaps scanner detects a bearish opening marking the presence of sellers ahead of buyers at the opening but not sufficiently marked to allow the price to register a quotation gap.
Bearish opening
Type : Bearish
Timeframe : Openning
Here is a more detailed summary of the historical variations registered by US FOODS HOLDING:
Near a new LOW record (1 month)
Type : Bearish
Timeframe : Weekly
Technical
Technical analysis of this Daily chart of US FOODS HOLDING indicates that the overall trend is slightly bearish. 50% of the signals given by moving averages are bearish. The overall trend could accelerate as a result of the strong bearish signals from short-term moving averages. There is no crossing of moving average by the price or crossing of moving averages between themselves.
In fact, 10 technical indicators on 18 studied are currently bearish. But beware of excesses. The Central Indicators scanner currently detects this:
Williams %R indicator is oversold : under -80
Type : Neutral
Timeframe : Daily
Williams %R indicator is overbought : over -20
Type : Neutral
Timeframe : Daily
Ichimoku - Bearish crossover : Tenkan & Kijun
Type : Bearish
Timeframe : Daily
Price is back over the pivot point
Type : Bullish
Timeframe : Weekly
No signals are given by Central Patterns, a market scanner specialised in chart patterns, resistances and supports.
Central Candlesticks, the scanner specialised in Japanese candlesticks, detects this inversion signal that could impact the current short-term trend:
Doji
Type : Neutral
Timeframe : Daily
| S3 | S2 | S1 | Price | R1 | R2 | |
|---|---|---|---|---|---|---|
| ProTrendLines | 36.99 | 38.06 | 38.81 | 39.17 | 40.60 | 42.81 |
| Change (%) | -5.57% | -2.83% | -0.92% | - | +3.65% | +9.29% |
| Change | -2.18 | -1.11 | -0.36 | - | +1.43 | +3.64 |
| Level | Minor | Minor | Major | - | Major | Major |
Pivot points can also be used to set your price objectives. Here is the price situation in relation to pivot points:
| Pivot points | S3 | S2 | S1 | PP | R1 | R2 | R3 |
|---|---|---|---|---|---|---|---|
| Standard | 38.65 | 38.88 | 39.09 | 39.32 | 39.53 | 39.76 | 39.97 |
| Camarilla | 39.19 | 39.23 | 39.27 | 39.31 | 39.35 | 39.39 | 39.43 |
| Woodie | 38.65 | 38.88 | 39.09 | 39.32 | 39.53 | 39.76 | 39.97 |
| Fibonacci | 38.88 | 39.05 | 39.15 | 39.32 | 39.49 | 39.59 | 39.76 |
| Pivot points | S3 | S2 | S1 | PP | R1 | R2 | R3 |
|---|---|---|---|---|---|---|---|
| Standard | 37.53 | 38.05 | 38.70 | 39.22 | 39.87 | 40.39 | 41.04 |
| Camarilla | 39.04 | 39.15 | 39.25 | 39.36 | 39.47 | 39.57 | 39.68 |
| Woodie | 37.61 | 38.08 | 38.78 | 39.25 | 39.95 | 40.42 | 41.12 |
| Fibonacci | 38.05 | 38.49 | 38.77 | 39.22 | 39.66 | 39.94 | 40.39 |
| Pivot points | S3 | S2 | S1 | PP | R1 | R2 | R3 |
|---|---|---|---|---|---|---|---|
| Standard | 35.94 | 37.44 | 38.56 | 40.06 | 41.18 | 42.68 | 43.80 |
| Camarilla | 38.95 | 39.19 | 39.43 | 39.67 | 39.91 | 40.15 | 40.39 |
| Woodie | 35.74 | 37.35 | 38.36 | 39.97 | 40.98 | 42.59 | 43.60 |
| Fibonacci | 37.44 | 38.44 | 39.06 | 40.06 | 41.06 | 41.68 | 42.68 |
Numerical data
The following is the status of the technical indicators and moving averages at the time of publication of this technical analysis:
| RSI (14): | 42.18 | |
| MACD (12,26,9): | -0.2800 | |
| Directional Movement: | 0.49 | |
| AROON (14): | -28.57 | |
| DEMA (21): | 39.32 | |
| Parabolic SAR (0,02-0,02-0,2): | 41.53 | |
| Elder Ray (13): | -0.21 | |
| Super Trend (3,10): | 41.55 | |
| Zig ZAG (10): | 39.17 | |
| VORTEX (21): | 0.9500 | |
| Stochastique (14,3,5): | 18.60 | |
| TEMA (21): | 39.15 | |
| Williams %R (14): | -84.24 | |
| Chande Momentum Oscillator (20): | -1.27 | |
| Repulse (5,40,3): | -0.5300 | |
| ROCnROLL: | 2 | |
| TRIX (15,9): | -0.1000 | |
| Courbe Coppock: | 3.24 |
| MA7: | 39.26 | |
| MA20: | 39.74 | |
| MA50: | 40.53 | |
| MA100: | 39.11 | |
| MAexp7: | 39.37 | |
| MAexp20: | 39.68 | |
| MAexp50: | 39.84 | |
| MAexp100: | 39.17 | |
| Price / MA7: | -0.23% | |
| Price / MA20: | -1.43% | |
| Price / MA50: | -3.36% | |
| Price / MA100: | +0.15% | |
| Price / MAexp7: | -0.51% | |
| Price / MAexp20: | -1.29% | |
| Price / MAexp50: | -1.68% | |
| Price / MAexp100: | -0% |
News
The last news published on US FOODS HOLDING at the time of the generation of this analysis was as follows:
- US Foods Announces Resignation of Chief Supply Chain Officer
- US Foods to Announce Third Quarter Fiscal 2019 Financial Results on November 5, 2019
- US Foods Delivers a World of Authentic, Global Flavors with Fall Scoop 2019
- US Foods Completes Acquisition of SGA’s Food Group of Companies
- US Foods to Present at the 2019 Wells Fargo Consumer Conference and Beauty Forum
About author

Online


Add a comment
Comments
0 comments on the analysis US FOODS HOLDING - Daily